
what you'll learn...
overview
In this page, learn how data collected can be used to predict future. This is an important lesson, and it is not found in any other books or websites.
predict future
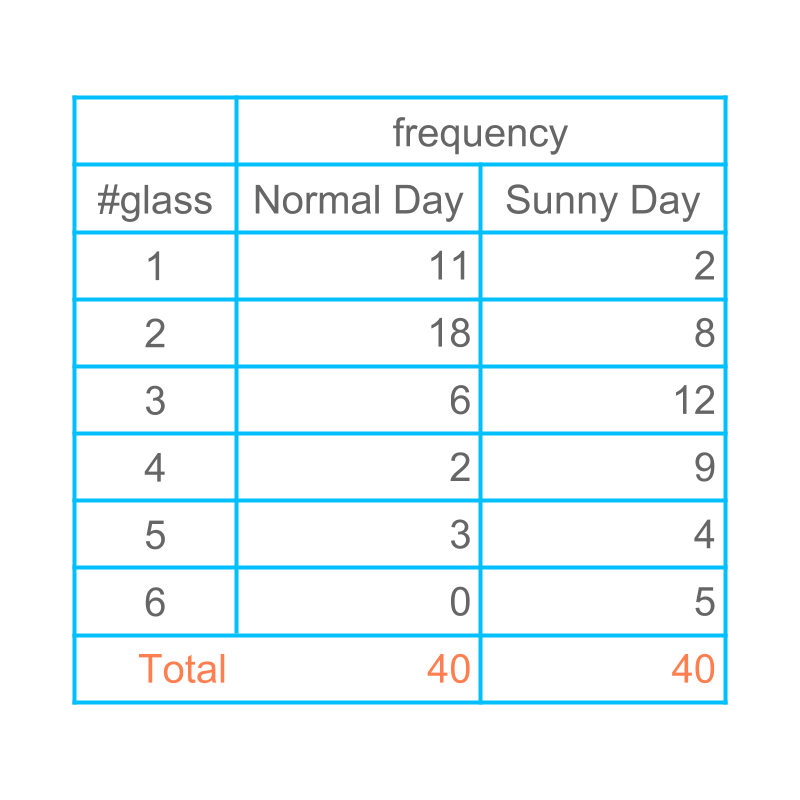
Consider the number of glasses of water students drink during normal day and sunny day. Today is a hot sunny-day. Can one predict how many students would require glasses of water today?
One student says : As per the data in the table, we can expect more or less students will drink glasses of water.
Another student says : The data represents the number of students who had glasses of water yesterday. There is no way we can predict how many will take today.
The first student's deduction is what we can best use. Though the data is for yesterday, We can expect more or less to the value in the data.
The objective of data-collection is to predict future.
predict data
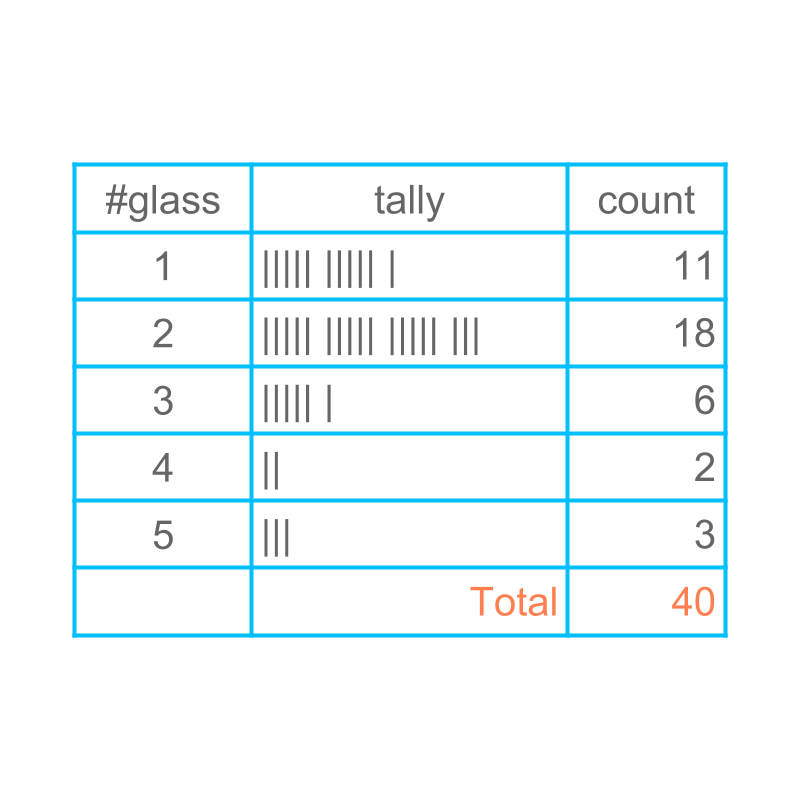
Consider the number of glasses of water students drink during normal day. The data is collected for 40 students. Next day another class of students is considered.
Even though a different class is considered, The data would be more or less same. The data may not be exactly equal, but one can expect that the data would be more or less same.
scale up the prediction
Consider the number of glasses of water students drink during normal day. The data is collected for 40 students. Next day another class of students is considered. For this set of students, the data would be more-or-less double of the data for students. The data may not be exactly double, but one can expect that the data would be more or less double.
scale down the prediction
Consider the number of glasses of water students drink during normal day. The data is collected for 40 students. Next day another class of students is considered. For this set of students, the data would be more-or-less half of the data for students. The data may not be exactly half, but one can expect that the data would be more or less half.
scale down to one
Consider the number of glasses of water students drink during normal day. The data is collected for students at the end of the day. Students are lined-up and one by one students provide information how many glasses of water they drank.
• First student says, glasses
• Second student says, glasses
• Third student says, glass
The data is understood in a different form for each student.
students out of would say glass
students out of would say glasses
students out of would say glasses
students out of would say glasses
students out of would say glassses
only student is considered. The big question is
Can one predict how many glasses one student would drink?
The prediction for one student can be given, but only in the context of large data.
The possible prediction based on the recorded-data is given below.
If the data-collection is repeated times,
• the data-value glass would appear times out of the times
• the data-value glasses would appear times out of the times
• the data-value glasses would appear times out of the times
• the data-value glasses would appear times out of the times
• the data-value glasses would appear times out of the times.
This is referred as : "probability" of the data value is .
statistics of coin toss
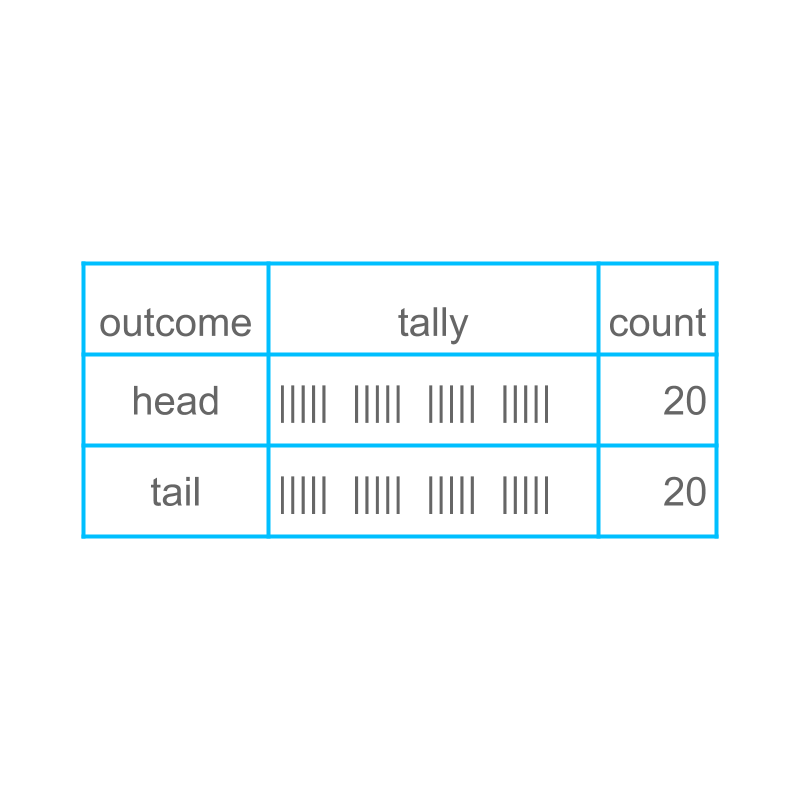
Let us consider another form of data. A person is tossing a coin, and recording the data. The data is shown in the tally and tabular form for tosses.
If the coin is tossed times, the coin will have more or less times heads and times tails.
transition
Considering data from tossing a coin.
If the coin is tossed once, the best one can say is the result will be come as heads for times in repetitions.
This is referred as "probability" of the data value "heads" is .
This is a transition from statistics to probability.
Statistics presents the collective data as it is. eg: When a coin is tossed times, the heads appears times and the tail appears times.
Probability specifies the same for one event. eg: When a coin is tossed, the probability of heads is .
summary
Predicting Based on Representative Data: Data can be used to predict the outcome of events.
Data is collected over a large number of iterations/repetitions.
It is known the result of one iteration can be one of many possibilities.
The result of one iteration is predicted in the context of the large-number-of-repetitions.
Outline
The outline of material to learn "basics of statistics and probability" is as follows.
Note: Click here for detailed outline of "Basics of Statistics and Probability"
• Introduction
→ Introduction to Statistics
→ Organizing Data : Tally Table
→ Pictograph
→ Bargraph
• Data Analysis
→ Cumulative Frequency
→ Representative Values of Data
→ Central Tendencies
→ Bargraphs & Piecharts
• Probability Fundamentals
→ Predicting Future
→ Random Experiment
→ Probability
→ Standard Experiments
• Statistics Grouped Data
→ Grouped Data
→ Probability in Grouped Data
→ Class Parameters of Grouped Data
→ Methods to find Mean of Grouped data
→ Mode of Grouped data
→ Median of Grouped Data