
what you'll learn...
overview
In this page, finding mean of grouped data is explained with some examples.
Simplified procedures to find mean are explained.
(a) assumed mean method,
(b) step deviation method
recap
The "mean" of a data is, the value derived by dividing the sum of all data values by number of data values.
Mean is also understood as the value when all data values are evenly distributed among the given data.
Consider the data: Number of pens carried by 10 students.
The mean of the data is computed as follows.
sum of all the data values =
count or number of data values
mean = sum / count
Mean is found when the data is given in raw format.
calculation of mean
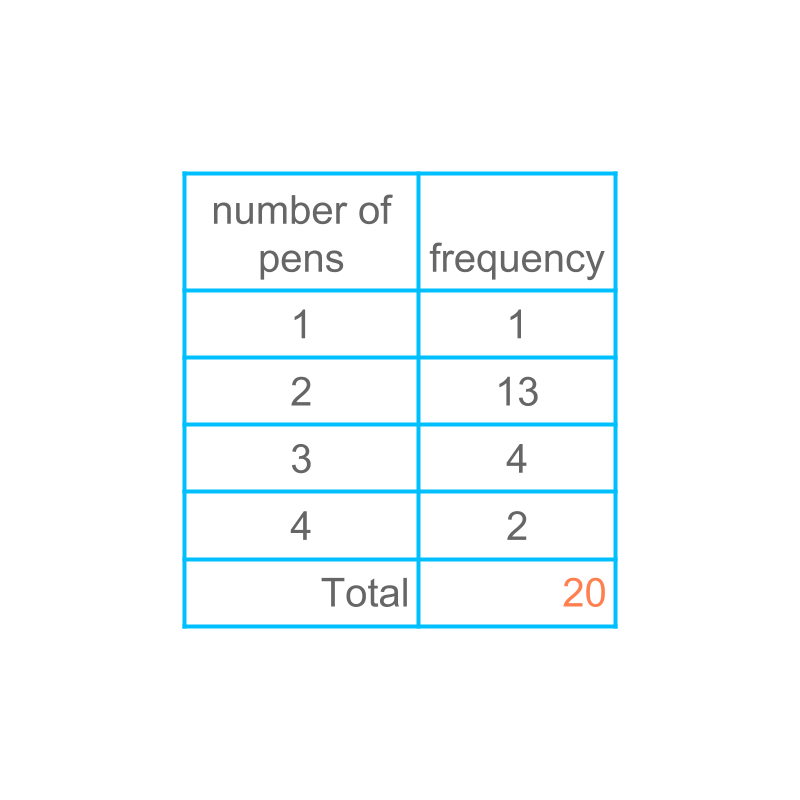
Consider the data given in the table.
The frequency of a data value represents how many times the value is repeated. So to find the sum of the given data values, find the sum of data value multiplied frequency.
This is illustrated in the next page.
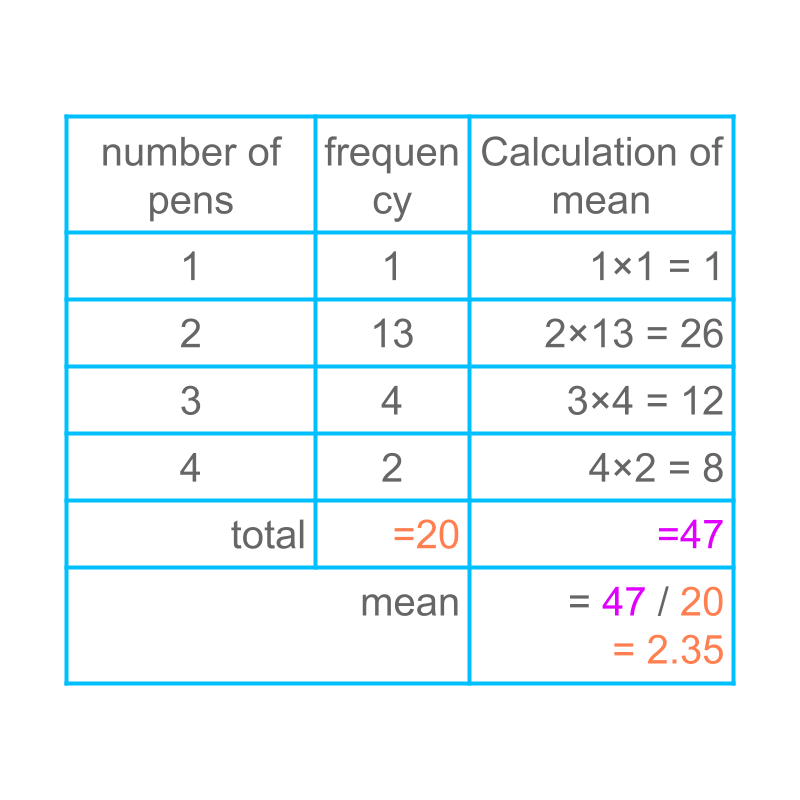
The calculation of mean is illustrated in the last column.
It is noted that the mean computed by this method would be same as that of the mean computed from the raw data.
summary
Mean = sum of all data values / number of data values.
The same is given as
Mean =
mean =
calculation of grouped-data mean
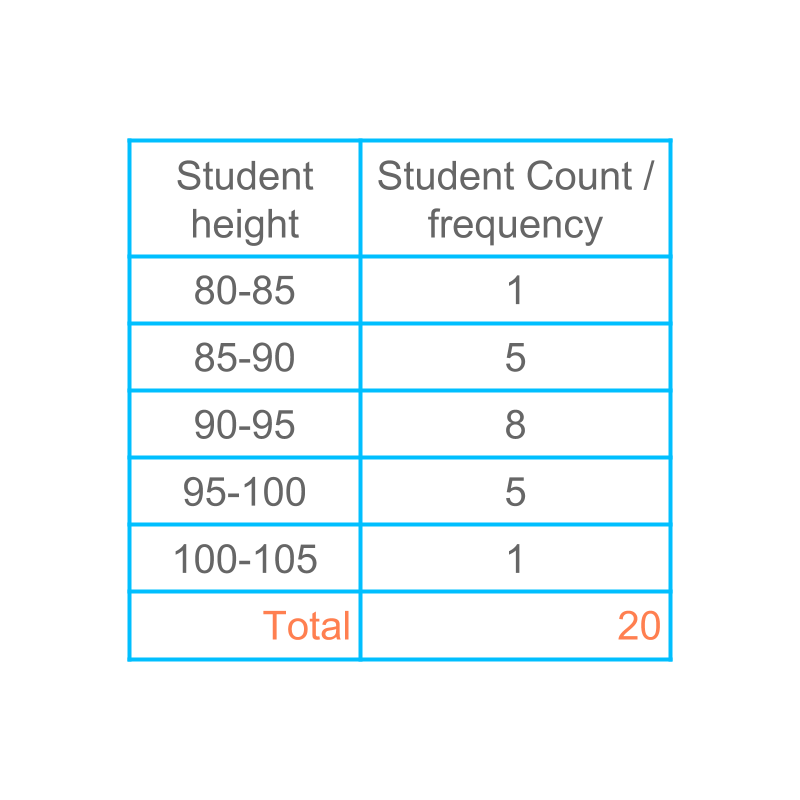
Consider the data given in the figure. Can the mean be computed for grouped data?
Let us study this in detail.
Consider finding mean of the grouped data given in the table.
Mean is defined as
To compute the mean, the class to is considered first. The value for is taken to be the class mark .
It is noted that the raw data can have values anywhere between and . Once the raw data is modified to grouped data, those raw data values are approximated to the class mark.
calcuating directly
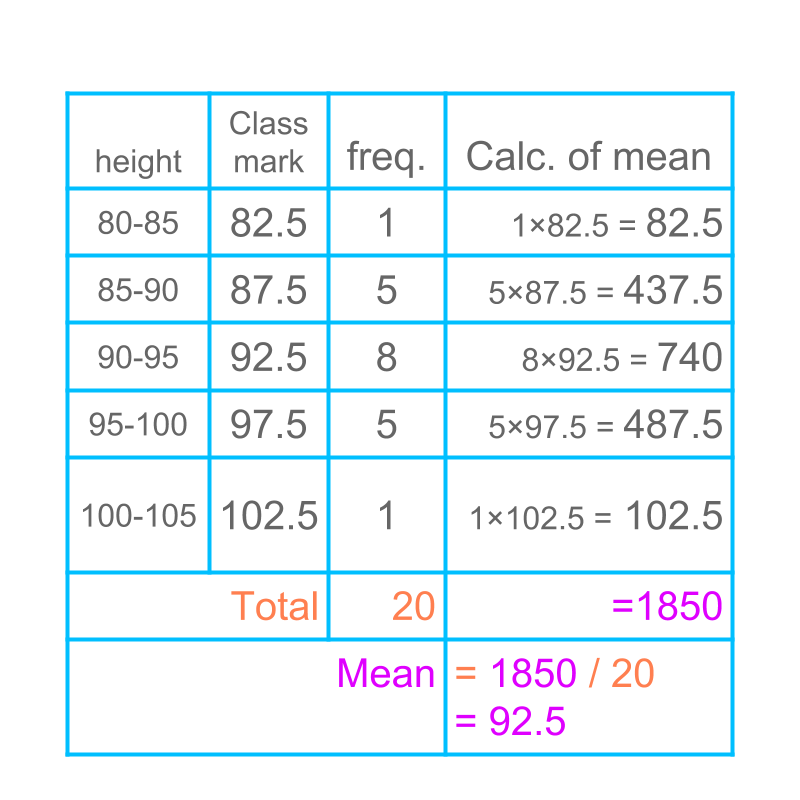
Computing mean of grouped data is given in the table. The last column provides the product of frequency and class-mark. The sum of the last column is divided by the sum of frequency. The result is the mean of the given data.
This method is called "direct method to find mean".
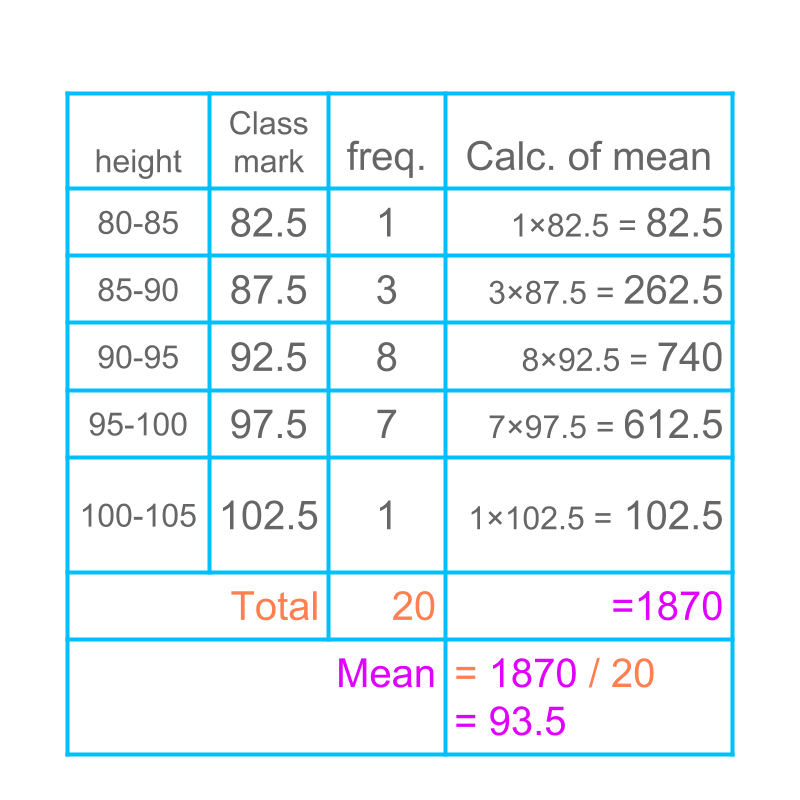
Another example of mean of grouped data is given in the table. The mean is computed by direct method.
summary
Direct Method to Compute Mean : mean =
simplify
Consider the direct method to find mean given in the table. It is noted that the multiplications involve large numbers, which require tedious calculations.

Calculation of mean can be simplified as given
mean =
Consider a value and modify the formula as
Substituting
mean =
by distributive law
mean =
as A is a constant
mean =
numerator and denominator in the second term are equal
mean =
mean =
helps to simplify the multiplications
is called the assumed mean.
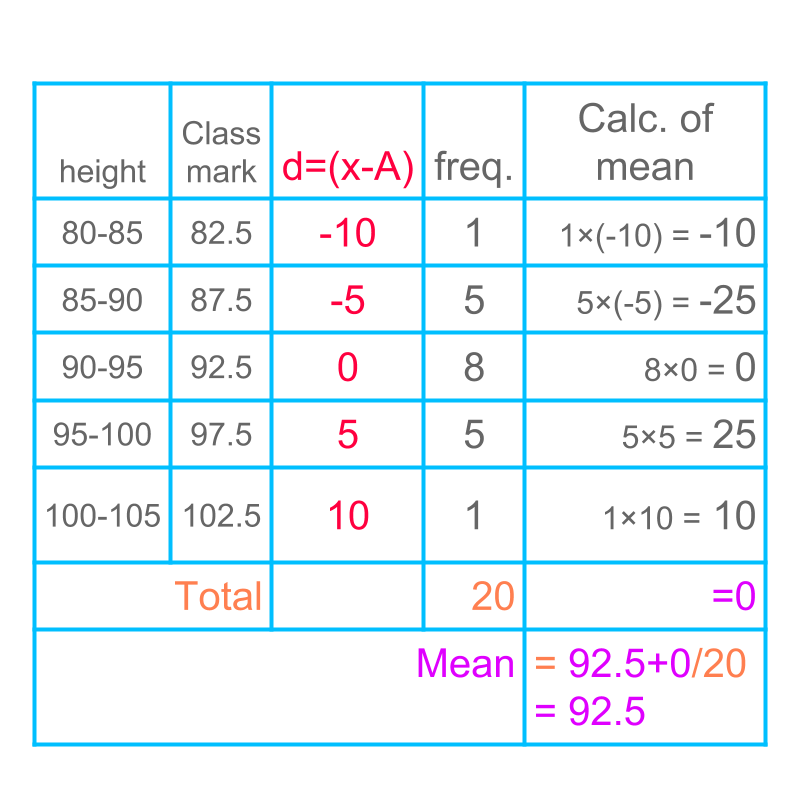
The calculation of mean with an assumed mean is illustrated in the table.
is taken to be . This simplifies the calculations.
It is noted that, the result is equal to the mean computed in direct method.
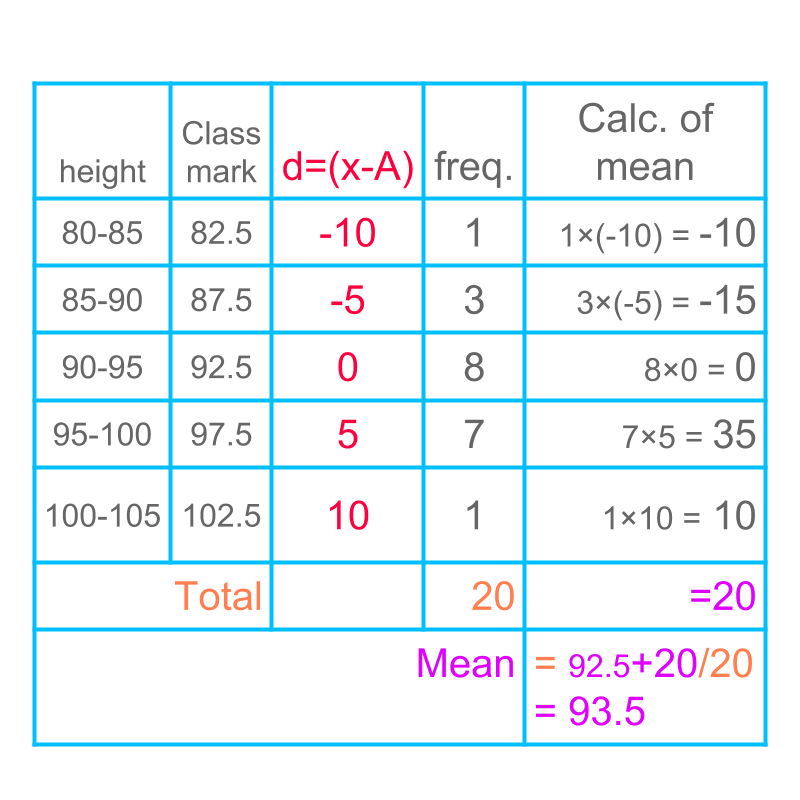
Another example of mean of grouped data is given in figure.
The mean is computed by assumed mean method.
summary
Assumed Mean Method to Compute Mean : mean =
simplify another way
The calculation of mean by assumed mean method is illustrated in the table. It is noted that the column is in the table is multiple of class interval.
And so the column can be divided by class interval to make the calculation simpler.

Calculation of mean is further simplified as given
mean =
Substituting
mean =
This method is called "step-deviation method".
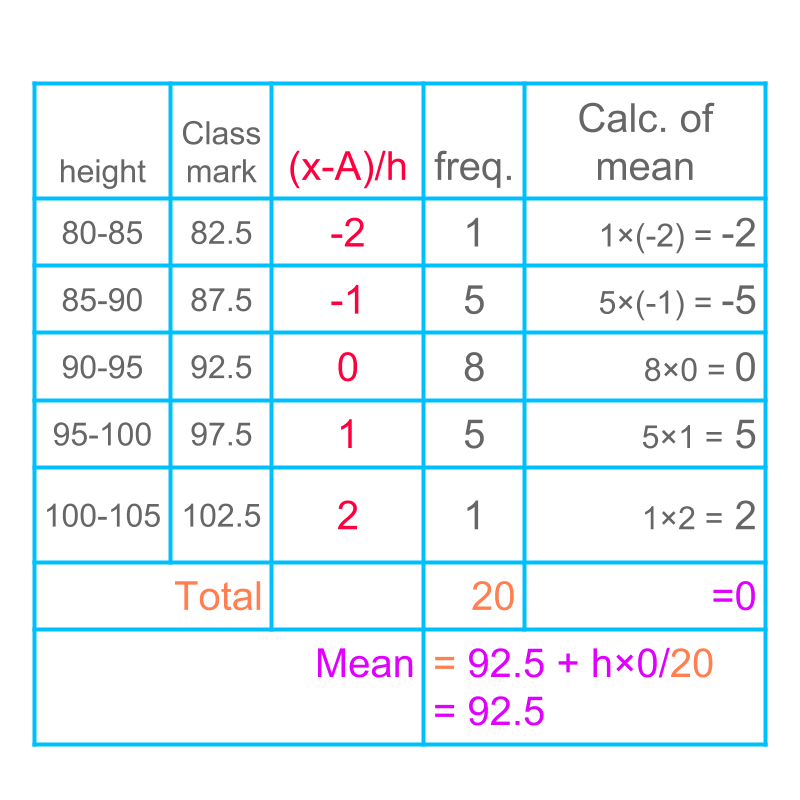
The calculation of mean by step-deviation method is illustrated in the table.
Assumed mean is taken to be and the step is taken to be . This simplifies the calculations.
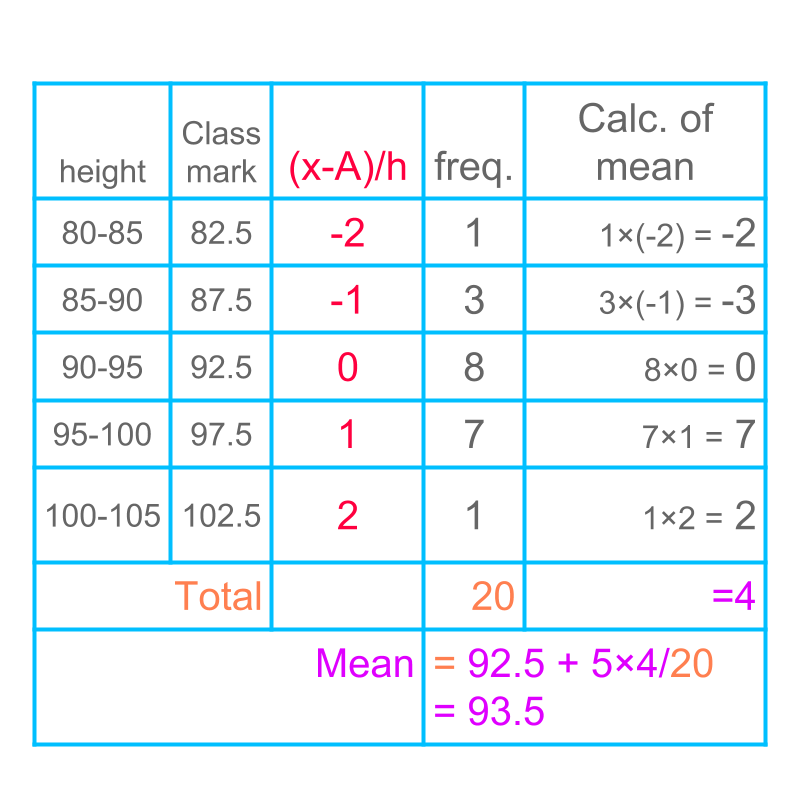
Another example of mean by step deviation method of grouped data is given in the table. The mean is computed by step deviation method.
summary
Step-Deviation Method to Compute Mean mean =
summary
Direct Method to Compute Mean : mean =
Assumed Mean Method to Compute Mean : mean =
Step-Deviation Method to Compute Mean mean =
Outline
The outline of material to learn "basics of statistics and probability" is as follows.
Note: Click here for detailed outline of "Basics of Statistics and Probability"
• Introduction
→ Introduction to Statistics
→ Organizing Data : Tally Table
→ Pictograph
→ Bargraph
• Data Analysis
→ Cumulative Frequency
→ Representative Values of Data
→ Central Tendencies
→ Bargraphs & Piecharts
• Probability Fundamentals
→ Predicting Future
→ Random Experiment
→ Probability
→ Standard Experiments
• Statistics Grouped Data
→ Grouped Data
→ Probability in Grouped Data
→ Class Parameters of Grouped Data
→ Methods to find Mean of Grouped data
→ Mode of Grouped data
→ Median of Grouped Data