
what you'll learn...
overview
In this page, finding probability of grouped data is explained with some examples.
predicting
Consider the data height of students in a class of students.
, , , ,
, , , ,
, , , ,
, , , ,
The figure shows the grouped data with ranges less than , to range, to range, and greater than .
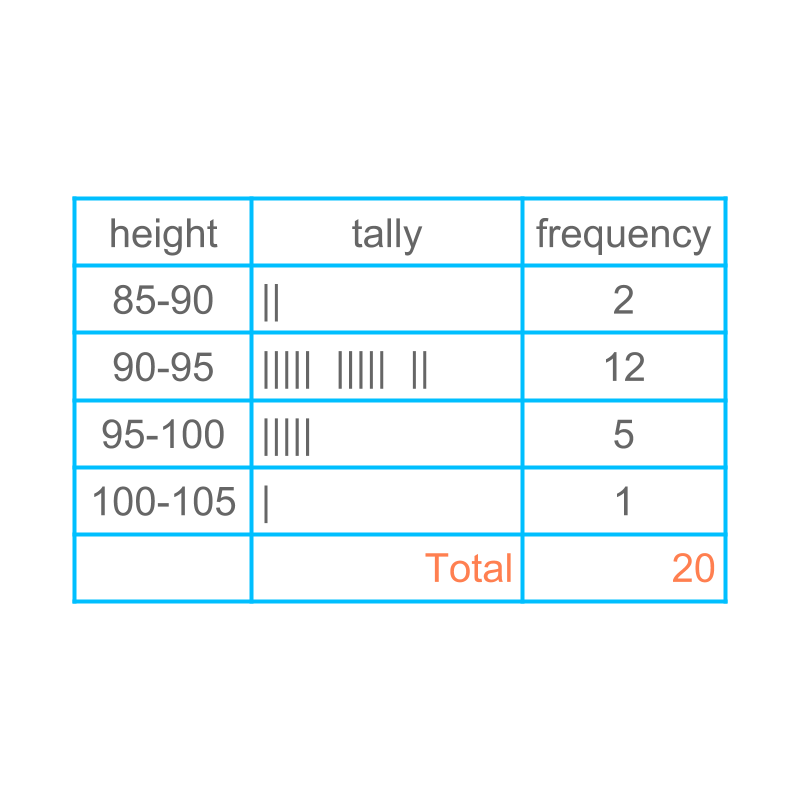
Considering this to be representative data for students of that age group, We try to predict the height of a student.
The probability of a random student in the height range to
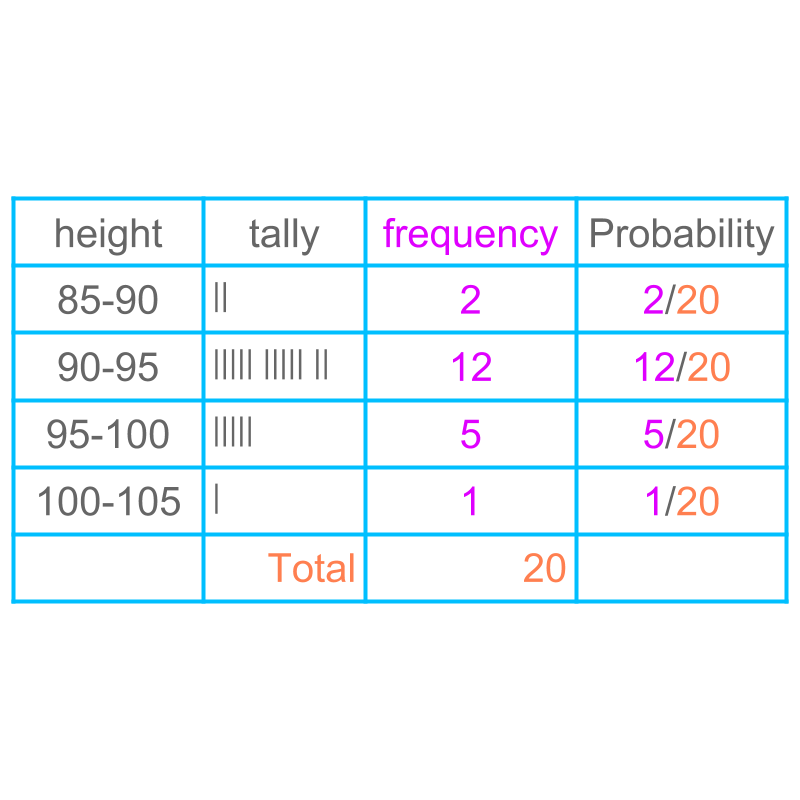
The probability of a random student of that age group in each of the range is given in the table.
zero probability
The probability of a random student to be exactly cm high is 0. It is noted that the probability of getting one particular value is in continuous distribution. This will be explained in detail in higher classes.
different representation
Consider the data height of students in a class of students.
, , , ,
, , , ,
, , , ,
, , , ,
The figure shows the grouped data with ranges less than , to range, to range, and greater than .
It is noted that, This is one possible grouping and the data can be grouped in different ranges.
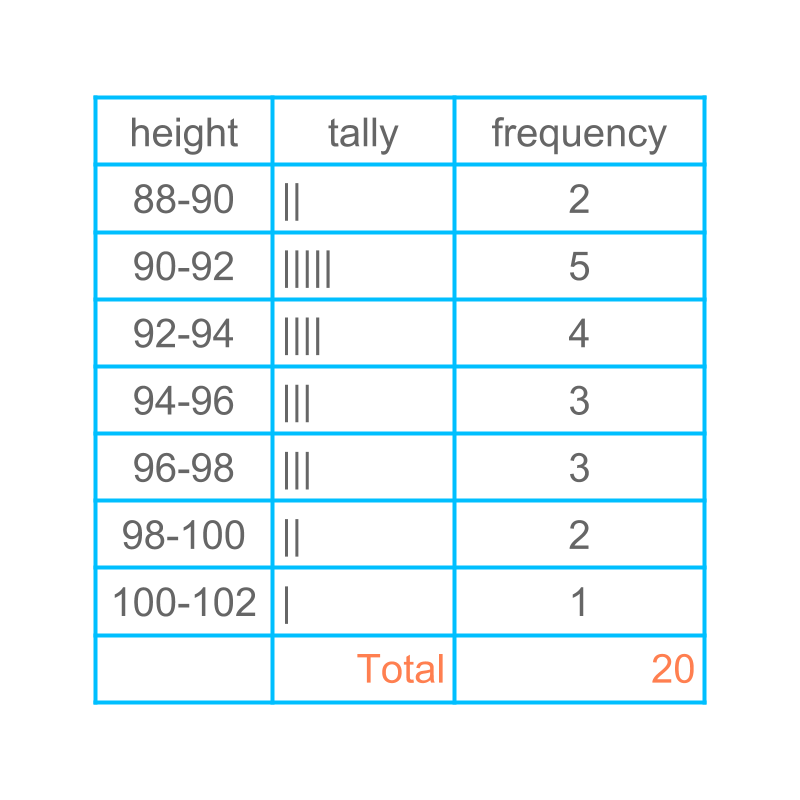
A dirrerent grouping is applied and the data is provided in the table.
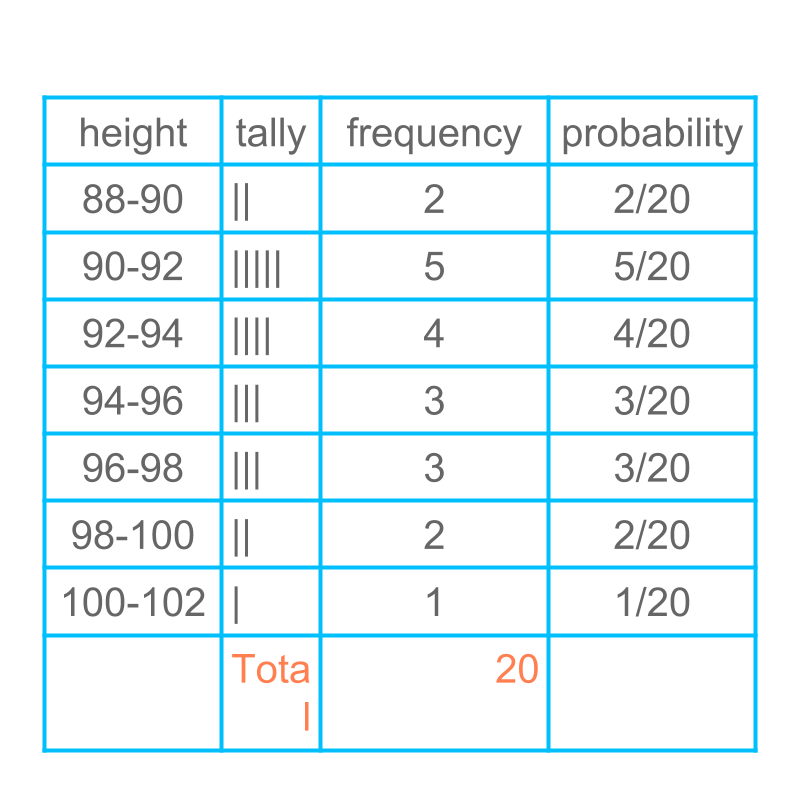
Probability of the same is given in the figure.
summary
Probability in Grouped Data : Probability is computed for of a range of values in grouped data.
Probability of a range equals, the number of occurances in the range, divided by, the number of occurances in the data.
Outline
The outline of material to learn "basics of statistics and probability" is as follows.
Note: Click here for detailed outline of "Basics of Statistics and Probability"
• Introduction
→ Introduction to Statistics
→ Organizing Data : Tally Table
→ Pictograph
→ Bargraph
• Data Analysis
→ Cumulative Frequency
→ Representative Values of Data
→ Central Tendencies
→ Bargraphs & Piecharts
• Probability Fundamentals
→ Predicting Future
→ Random Experiment
→ Probability
→ Standard Experiments
• Statistics Grouped Data
→ Grouped Data
→ Probability in Grouped Data
→ Class Parameters of Grouped Data
→ Methods to find Mean of Grouped data
→ Mode of Grouped data
→ Median of Grouped Data