
what you'll learn...
overview
In this page, finding median of grouped data is explained with some examples.
recap
Median of a data is, the value that has equal number of smaller and larger data values in the given data.
Consider the data: Number of pens carried by 10 students.
The median of the data is computed as follows.
arrange the data in ascending order =
count / number of data values
Find the position of middle value . So the avaerage of data values in position and is the median.
Median
finding median using frequency
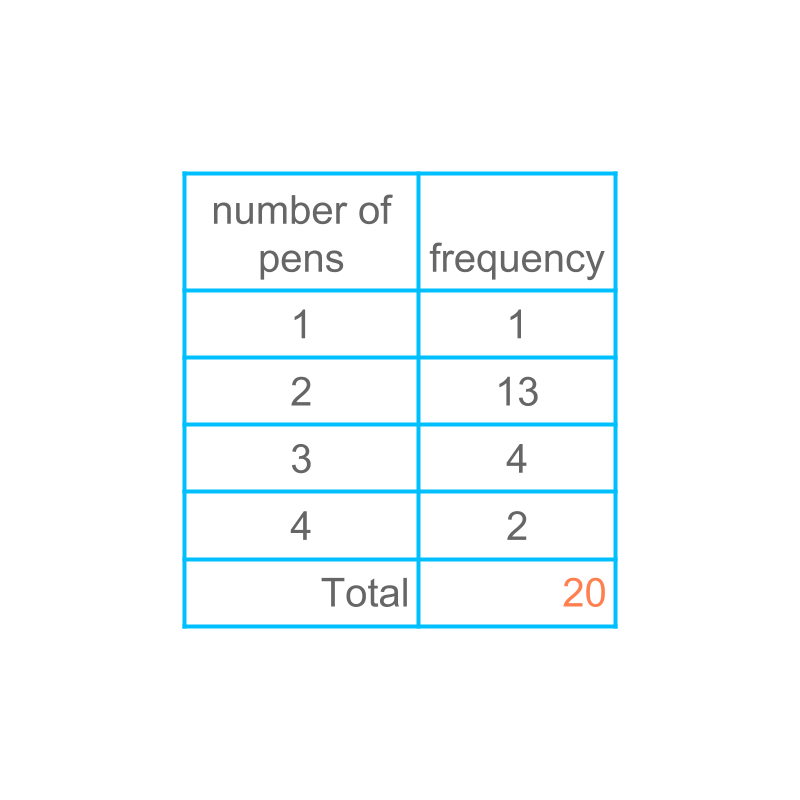
Consider the data given in the table in frequency form. To compute the median, the frequency of the data values can be used.

Considering the data given in the table. The calculation of median is illustrated in the table. It is noted that the median computed using the frequency form and the median computed using the raw data are identical.
median of grouped-data
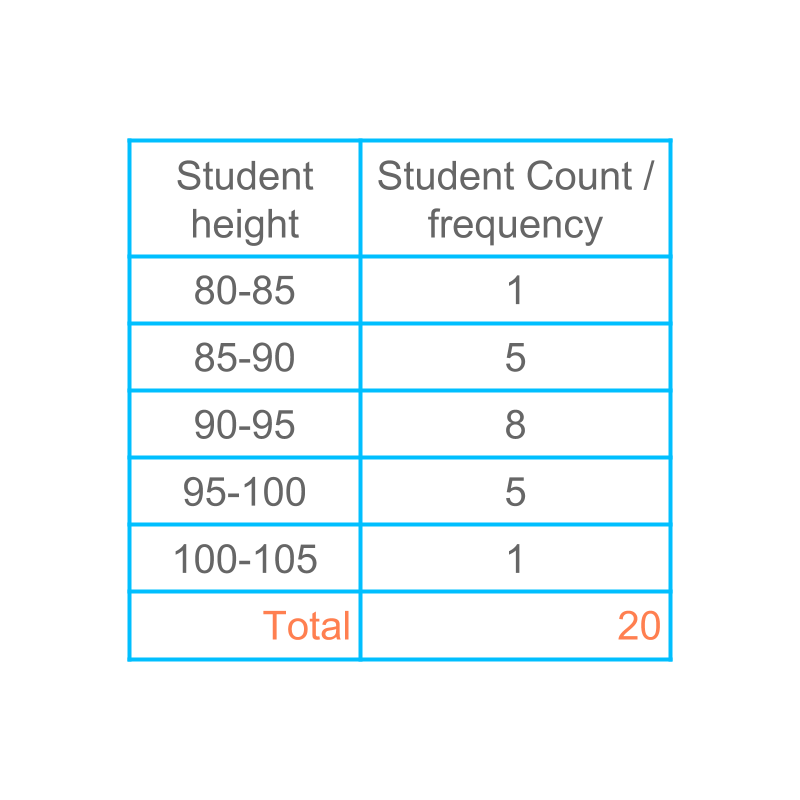
Consider the grouped data given in the figure. Let us study how median can be computed for grouped data.
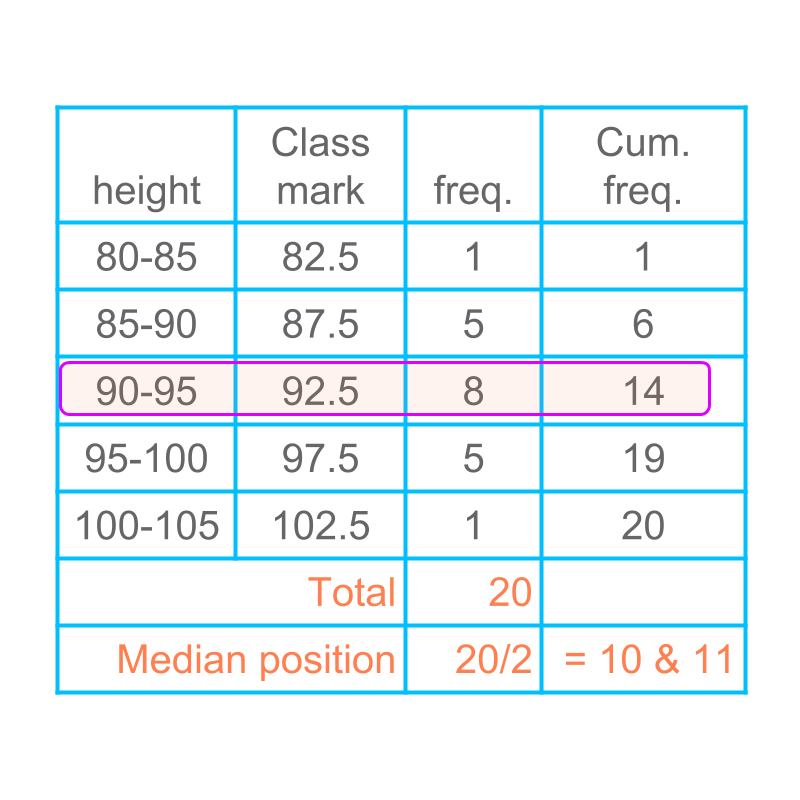
Computing median of grouped data is given in the table.
The last column provides the cumulative frequency. The average of data values in positions and is the median class of this data. So the median class is
Note that the height value or the class mark values are arranged in the ascending order while computing the median.

Another example of computing median class of grouped data is given in the table.
summary
Computing Median of Grouped Data : Arrange the classes in ascending order and the class-mark of the class having center of the data is the median.
Outline
The outline of material to learn "basics of statistics and probability" is as follows.
Note: Click here for detailed outline of "Basics of Statistics and Probability"
• Introduction
→ Introduction to Statistics
→ Organizing Data : Tally Table
→ Pictograph
→ Bargraph
• Data Analysis
→ Cumulative Frequency
→ Representative Values of Data
→ Central Tendencies
→ Bargraphs & Piecharts
• Probability Fundamentals
→ Predicting Future
→ Random Experiment
→ Probability
→ Standard Experiments
• Statistics Grouped Data
→ Grouped Data
→ Probability in Grouped Data
→ Class Parameters of Grouped Data
→ Methods to find Mean of Grouped data
→ Mode of Grouped data
→ Median of Grouped Data