
what you'll learn...
overview
In this page, the tally and table representations are introduced with example
• Tally representation uses vertical bars (that are grouped into ) is used to collect data.
• In table representation, data is given in tabular form.
on-going data collection
In a plate, oranges, apples, bananas, and mangoes were available. A group of students took one fruit each as given in the data.
The data is given as
students took oranges
students took apples
students took mangoes
student took banana
Continuing on, the next student takes an orange, and then the following student takes a mango.
To update the information, the oranges is changed to ; and mangoes is changed to .

To continue on an on-going data collection, the "tally" representation helps.
The data is given in tally representation in the figure. Note the number of vertical lines given in each row. The data value is represented with vertical lines. A collection of is represented with a diagonal line on four vertical lines.
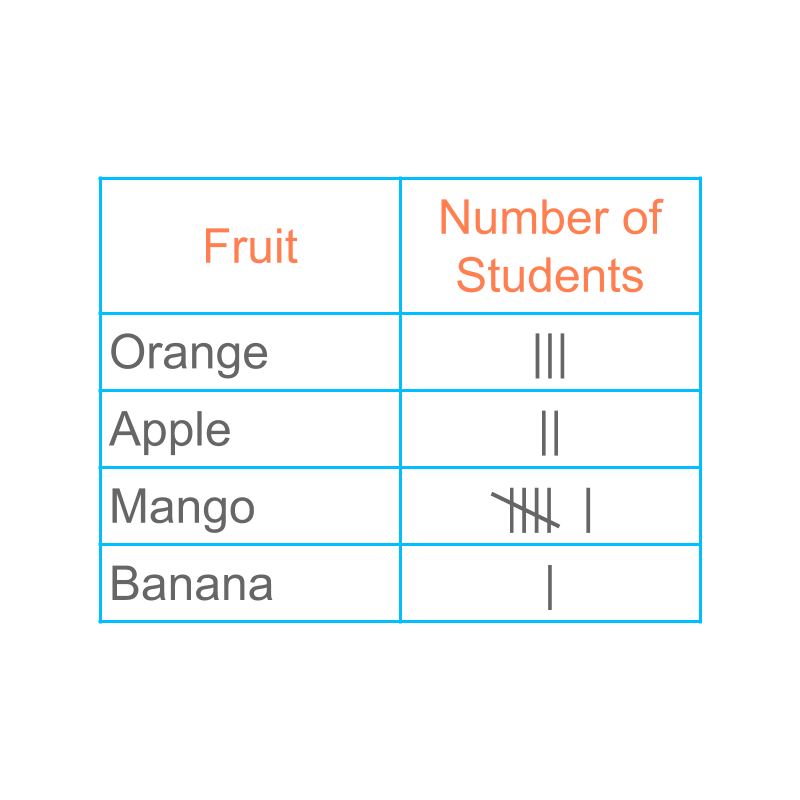
Continuing on, the next student takes an orange, and then the following student takes a mango. The tally representation is updated easily.
The word "tally" means: current amount; ongoing count.
represent, once completed
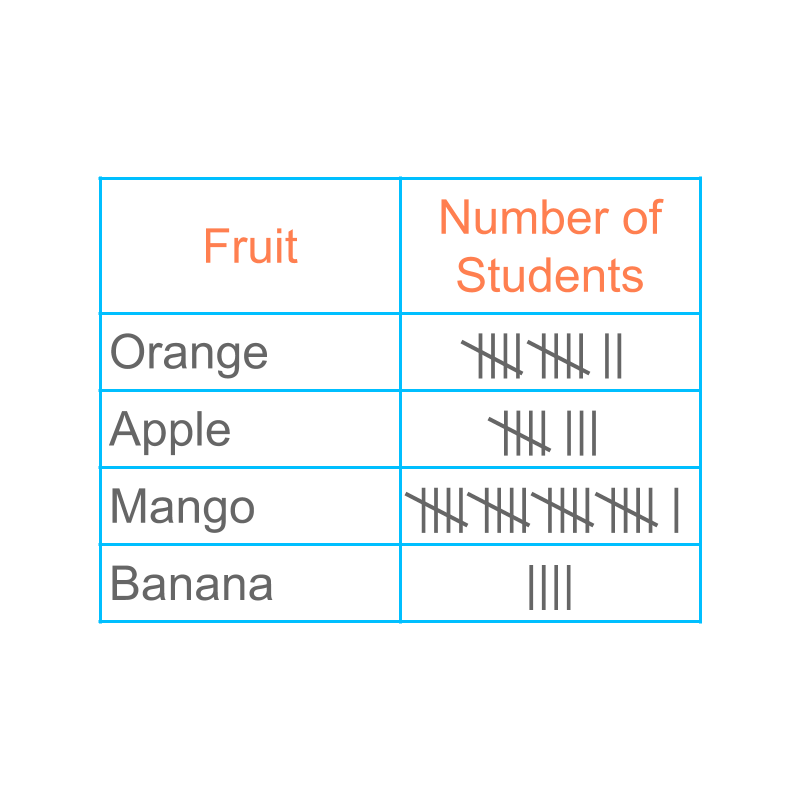
Consider the tally representation of data given in the figure.
It is not straight forward to find the number of students who took mangoes. Some counting and adding has to be done to find the answer.
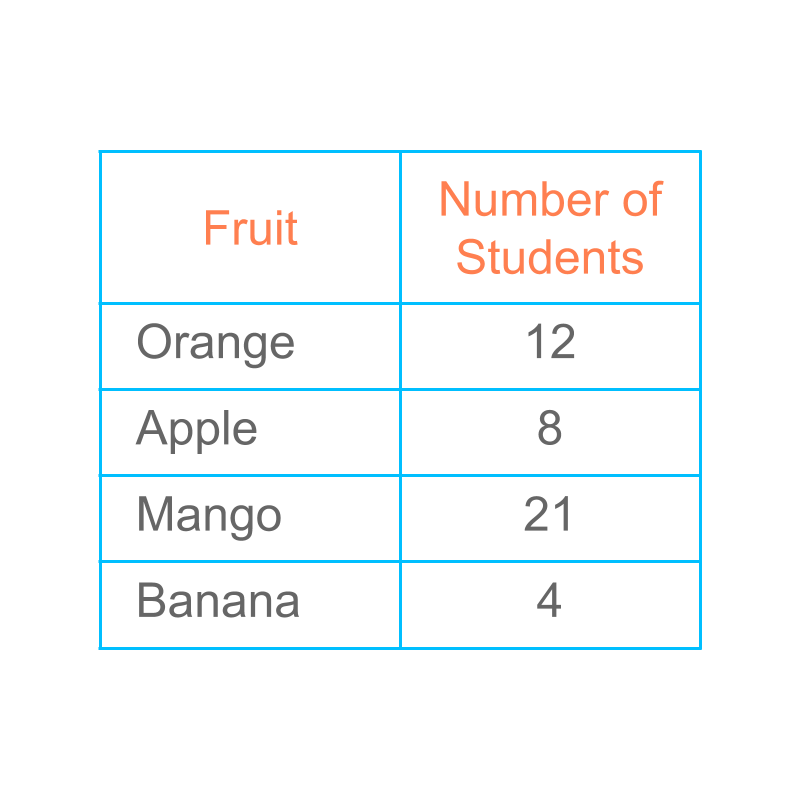
Tally representation is suitable to record an on-going data collection. Once the data collection is completed, the same can be given in the tabular form.
The data given in tally is equivalently given in a "table". This representation is also called "tabulation of data".
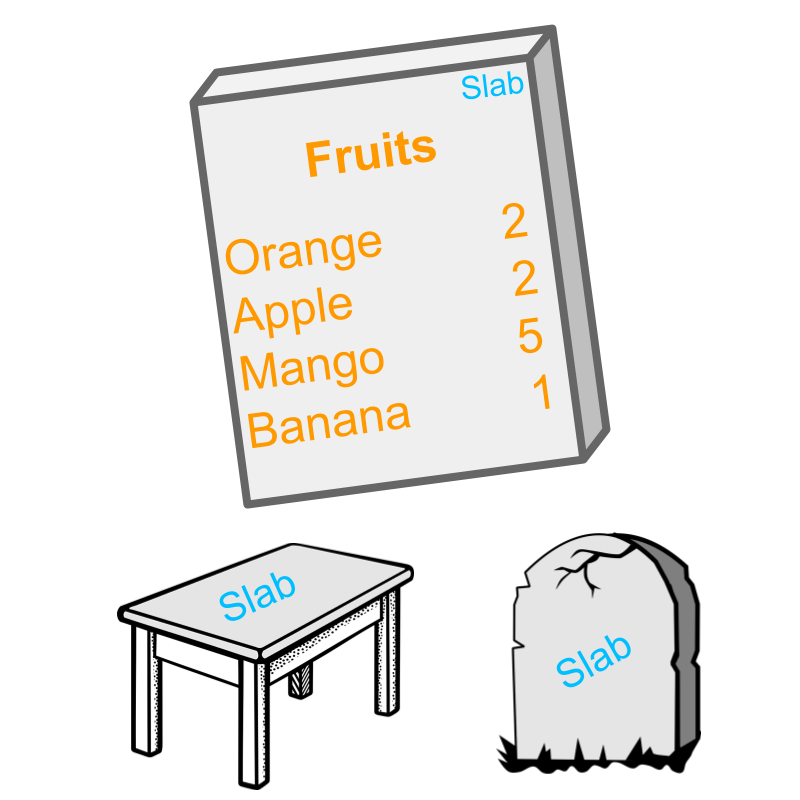
The word "table" means: a flat rectangular surface. The surface can be vertical with inscriptions.
summary
Presenting Data with Tally Marks : Vertical bars (that are grouped into ) is used to collect data.
Presenting Data in a Table : The data is given in a tabular form.
Outline
The outline of material to learn "basics of statistics and probability" is as follows.
Note: Click here for detailed outline of "Basics of Statistics and Probability"
• Introduction
→ Introduction to Statistics
→ Organizing Data : Tally Table
→ Pictograph
→ Bargraph
• Data Analysis
→ Cumulative Frequency
→ Representative Values of Data
→ Central Tendencies
→ Bargraphs & Piecharts
• Probability Fundamentals
→ Predicting Future
→ Random Experiment
→ Probability
→ Standard Experiments
• Statistics Grouped Data
→ Grouped Data
→ Probability in Grouped Data
→ Class Parameters of Grouped Data
→ Methods to find Mean of Grouped data
→ Mode of Grouped data
→ Median of Grouped Data