
what you'll learn...
overview
In this page, the bar-graph representation of Data is explained with simple examples.
• Bar graph is a spatial representation of data with bars in vertical and horizontal axis
bar
In the earlier lessons, Data representation using tally marks, table, and pictograph were explained. These representations were useful to understand details like which data-value is large, which data-values are comparable , etc.
The data can be given in a spatially laid out visual form. It is widely used in newspapers and other publications.
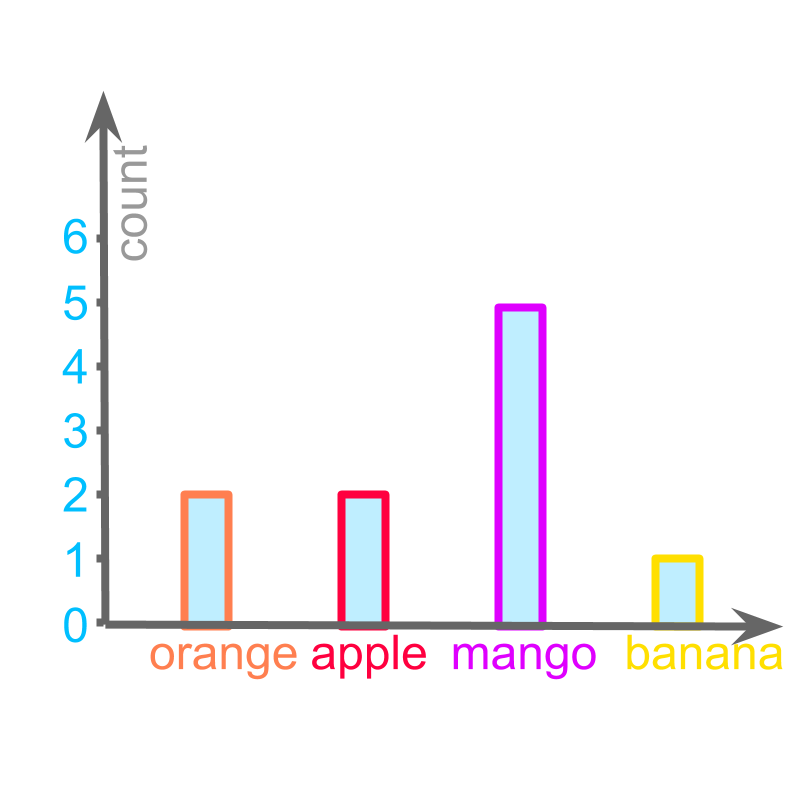
Consider the data: Number of students who took a given fruit.
orange
apple
mango
banana
The figure depicts a "bargraph" of the data.
The word "bar-graph" means: data represented with bars. The representation can be with horizontal or vertical bars.
scaling the bar
Earlier, we learned about scaling in pictographs. Scaling was introduced to represent large data-values.
The bar graphs have a similar problem. The numbers marked in vertical axis will be too close for large values.
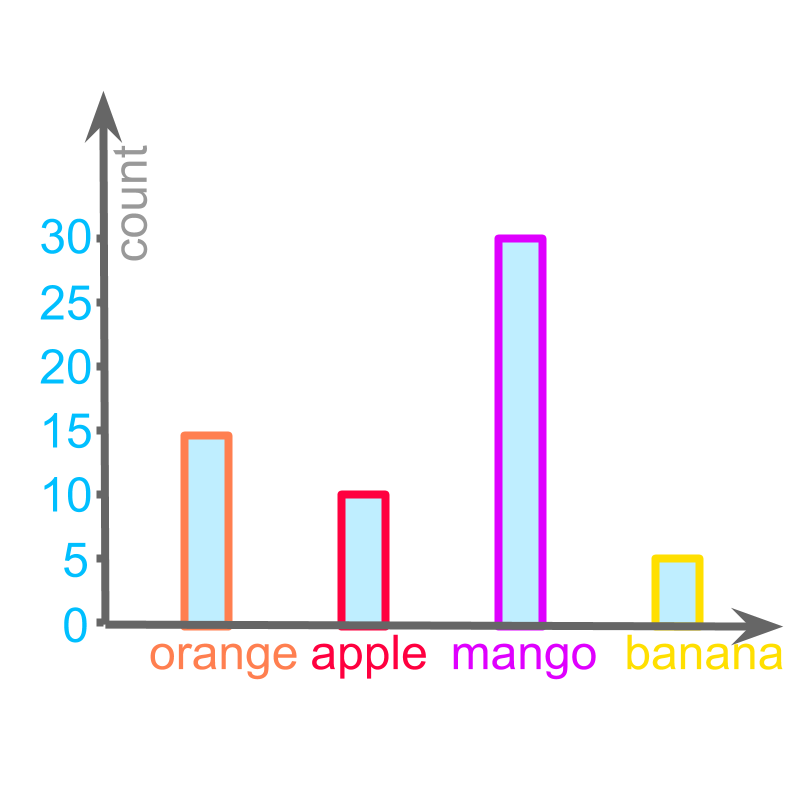
The following data is represented:
Orange :
Apple :
Mango :
Banana :
Instead of marking each of the values in the vertical axis, the values are marked in increment of . This is illustrated in the figure.
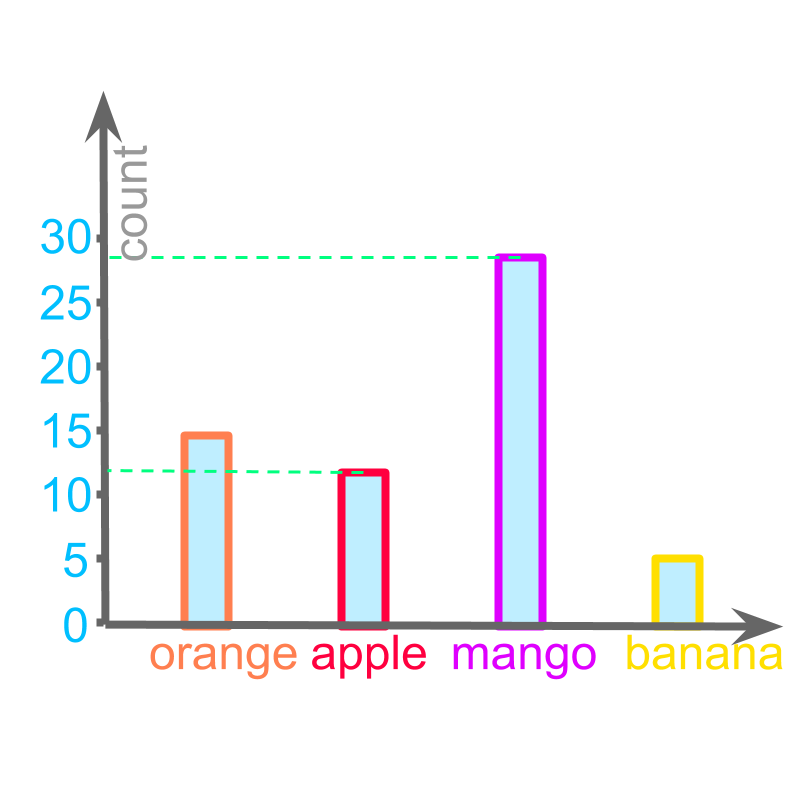
The number of apples is represented with a vertical bar of height .
Similarly the number of mangoes is represented with a vertical bar of height .
summary
Bar-Graph : A spatial representation of data with bars in vertical and horizontal axis.
Outline
The outline of material to learn "basics of statistics and probability" is as follows.
Note: Click here for detailed outline of "Basics of Statistics and Probability"
• Introduction
→ Introduction to Statistics
→ Organizing Data : Tally Table
→ Pictograph
→ Bargraph
• Data Analysis
→ Cumulative Frequency
→ Representative Values of Data
→ Central Tendencies
→ Bargraphs & Piecharts
• Probability Fundamentals
→ Predicting Future
→ Random Experiment
→ Probability
→ Standard Experiments
• Statistics Grouped Data
→ Grouped Data
→ Probability in Grouped Data
→ Class Parameters of Grouped Data
→ Methods to find Mean of Grouped data
→ Mode of Grouped data
→ Median of Grouped Data