
what you'll learn...
overview
In this page, grouped data is introduced and explained with some examples.
recap
We studied about data recording and presentation with tally marks and tabular form. Then we studied about bar-graphs to represent the data in a spatially laid-out form which helps to compare data or find the minimum or maximum, etc.
it works
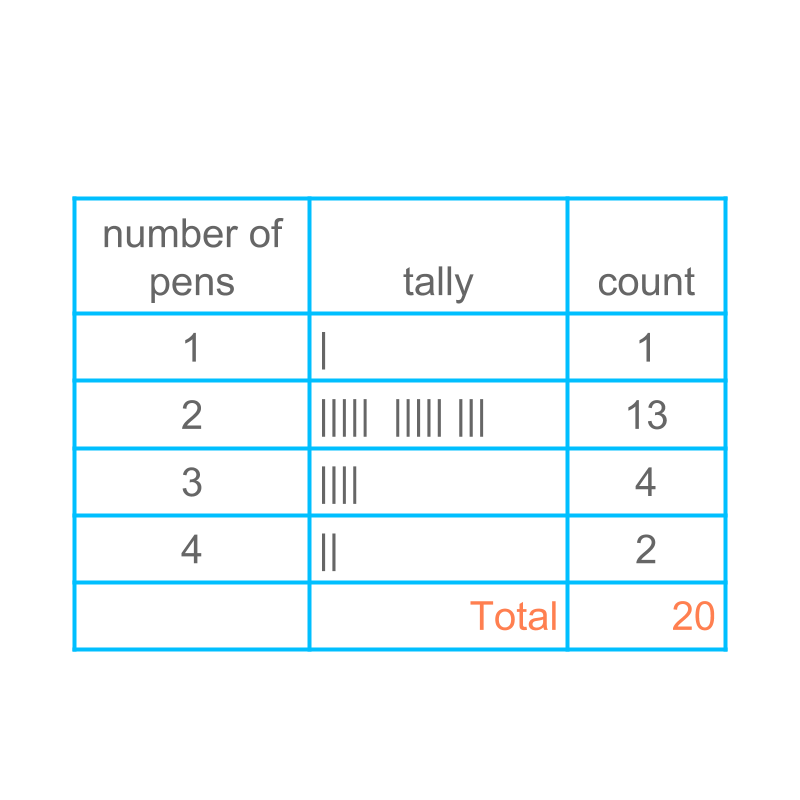
Consider the number of pens a student carries in a group of students. The raw data is given as :
, , , ,
, , , ,
, , , ,
, , , ,
The figure provides the tally and tabular representation of the given raw data.
it does not work
Consider the data height of students in a class of students.
, , , ,
, , , ,
, , , ,
, , , ,
Note that none of the data values repeat, and there are distinct values. If we are to prepare tally form of the data, each data point would get one bar.
Can the data be presented in tally and table form? Not as it is given.
make it work
The data will not be used to answer questions like "How many students are of the height cm?" The answer to this kind of questions is always none.
The data is primarily used to answer questions similar to
How many students are in the range to cm height? (which is as per the normal height for the age.)
How many students are below the lower limit cm? (Which is below the healthy height for the age.)
How many students are above cm ?
To cater to this, the data can be grouped into small segments of the data values.
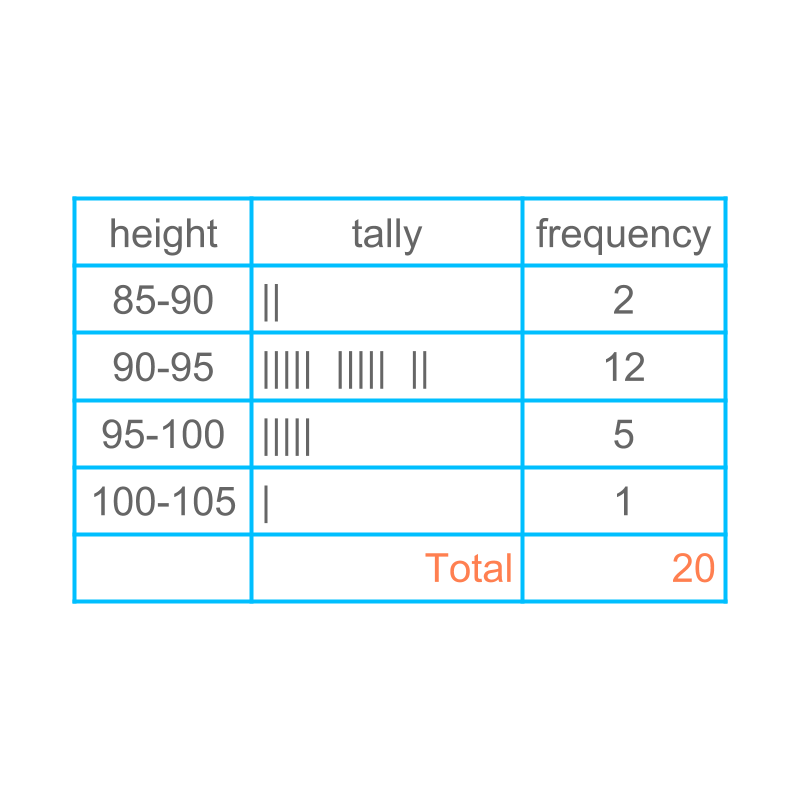 The figure illustrates the tally and table form of grouped data.
The data is grouped as
The figure illustrates the tally and table form of grouped data.
The data is grouped as
less than
to
to
above
make bargraph work too
Considering the data: height of students in a class of students.
Bar-graph are usually defined for distinct values: eg: , , etc.
The data in figure is continuous ranges : eg to and to , etc.
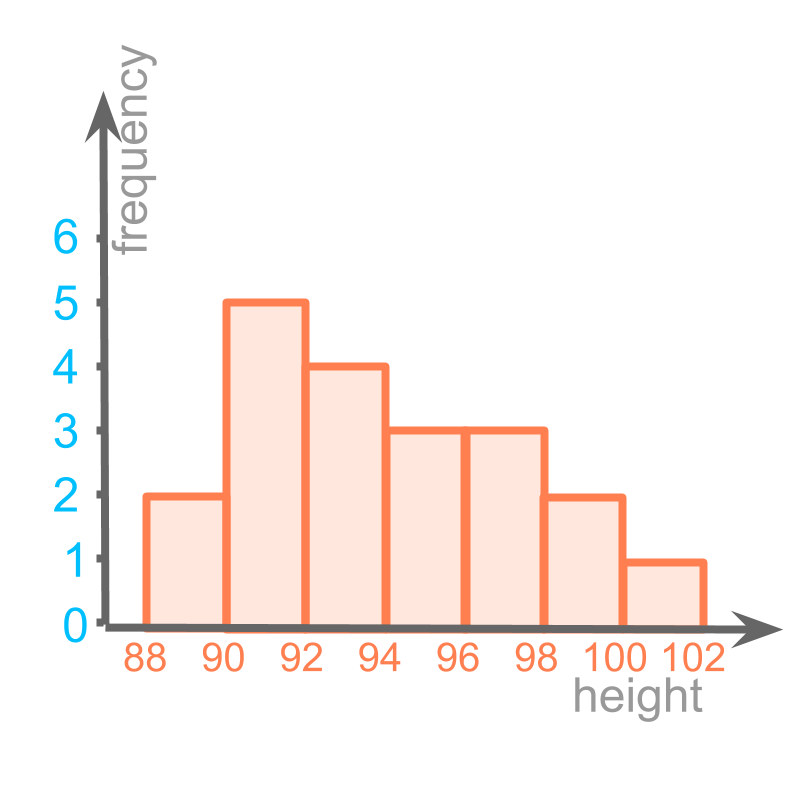
This continuous scale be reflected in a bar-graph, by making the bars touching each other to reflect continuity.
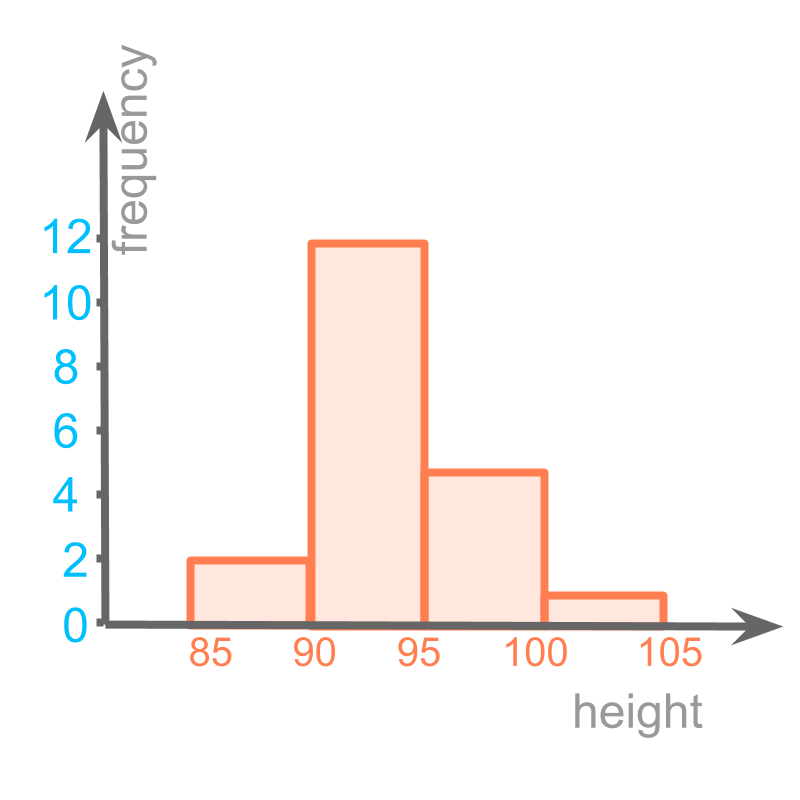
The bar graph with continuous range is shown in the figure.
This form of bar-graph is called "histogram".
The word "histogram", means written or recorded information in the form of vertical bars".
"-gram" : written or recorded information + "histo" : in the form of vertical bars.
different possibilities in grouping
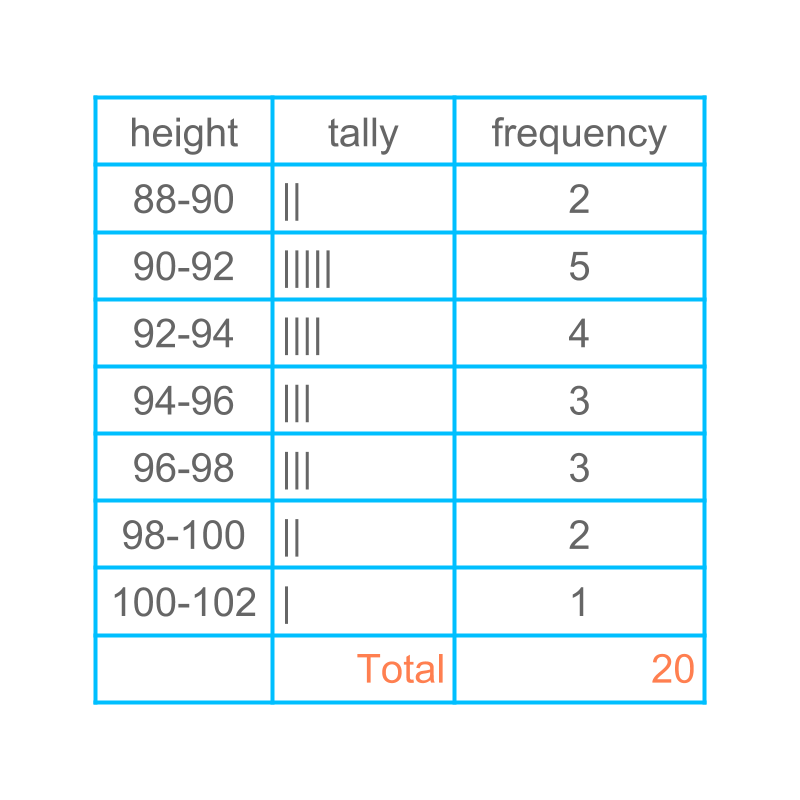
Considering the data height of students in a class of students. A different grouping is presented in the figure.
Histogram of the same is given in the figure.
summary
Grouped data : Data can be grouped into small segments of the data values.
The figure illustrates the tally and table form of grouped data.
Histrogram : A representation of data similar to bar-graph with continuous scale on the horizontal axis.
Outline
The outline of material to learn "basics of statistics and probability" is as follows.
Note: Click here for detailed outline of "Basics of Statistics and Probability"
• Introduction
→ Introduction to Statistics
→ Organizing Data : Tally Table
→ Pictograph
→ Bargraph
• Data Analysis
→ Cumulative Frequency
→ Representative Values of Data
→ Central Tendencies
→ Bargraphs & Piecharts
• Probability Fundamentals
→ Predicting Future
→ Random Experiment
→ Probability
→ Standard Experiments
• Statistics Grouped Data
→ Grouped Data
→ Probability in Grouped Data
→ Class Parameters of Grouped Data
→ Methods to find Mean of Grouped data
→ Mode of Grouped data
→ Median of Grouped Data