
what you'll learn...
overview
In this page, learn how statistical data can be used to predict an outcome of a random experiment.
Such prediction requires large effort and small variations in the data can cause errors.
So the possible outcomes are theorized as having equal chances and the probability of an outcome is defined.
handling variation in data
A person is tossing a coin for times, and recording the data. The data is shown in tabular form for different trials.
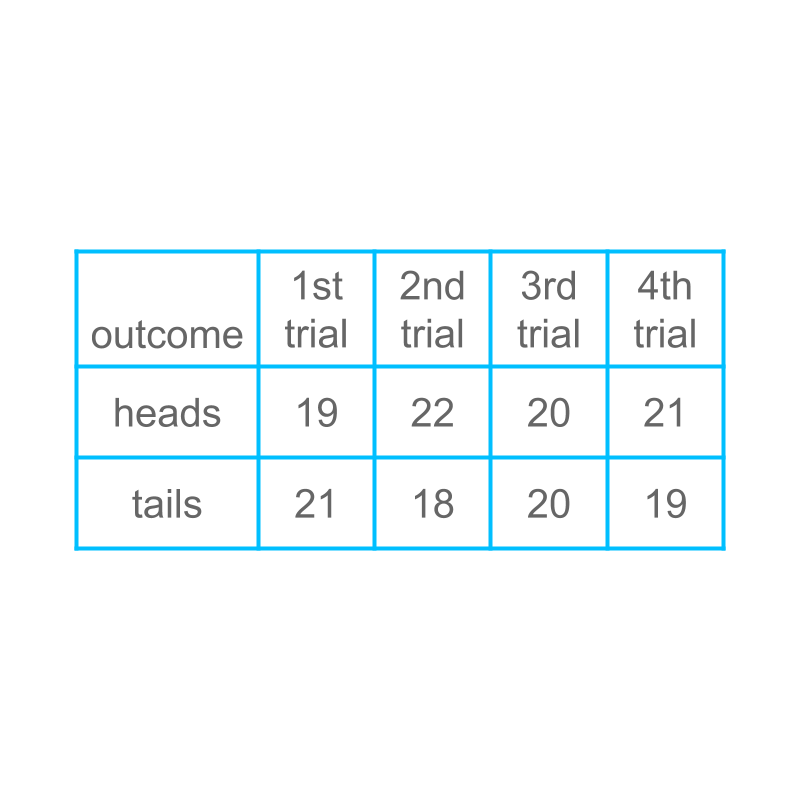 If the coin is tossed once, what is the probability of 'tails'? Is it , , , or ?
The data is more or less , so the probability = .
This is not a precise explanation, though broadly it is correct. The following provides the precise explanation for taking the probability as .
The nature of random experiments is that, there is always some variation in outcome. The occurrence of 'tails' is , , , or in four trials.
But, we understand that the 'heads' and 'tails' have equal chance and so we theorize that the probability of 'tails' is . The data from experiments is used to verify if the result of the experiment is approximately .
Note:
We started with collecting data and representing that.
Then we learned using data to predict result of random experiments.
Now, as the data is not accurate, (that is data varies little in small number of experiments), we try to learn parameters of the experiment and make a call on predicting the results. In such prediction, data helps to validate the prediction. This is further explained with examples in pages to follow.
fomulation of equal chance
Considering tossing a coin, and the sample space is 'heads' and 'tails'.
The result of the toss can be either one with equal chance.
Knowing that the sample space has equal chance, the probability of "heads" is , where
• numerator is the count of outcomes in the event
• denominator is the count of outcomes in the sample-space.
summary for coin-toss
The number of outcomes in the sample space is .
The outcomes in sample space have equal chance to be the result.
The desired event is one of outcomes.
The probability = .
In tossing a coin for 'heads':
• The sample space is 'heads' and 'tails'. That is a count of .
• The desired event is the outcome 'heads'. That is a count of .
• The Probability of event 'heads' = .
formulate rolling a dice
Consider rolling a dice. The sample space of this experiment is '', '', '', '', '', and ''.
The outcomes in the sample-space have equal chance.
The probability of is , where
• numerator is the count of outcomes in the event
• denominator is the count of outcomes in the sample-space.
summary for dice-roll
The number of outcomes in the sample space is .
The outcomes in the sample space have equal chance.
The desired event is one of outcomes.
The probability = .
In rolling a dice for :
• The sample space is '', '', '', '', '', and ''. That is a count of .
• The desired event is the outcome ''. That is a count of .
• The Probability of event '' = .
odd number from dice
Consider rolling a dice. The sample space is '', '', '', '', '', and '' and all outcomes in the sample space have equal chance.
The probability of an odd number is where
• numerator is the count of outcomes in the event (1, 3, 5)
• denominator is the count of outcomes in the sample-space.
In rolling a dice for an odd number:
• The sample space is '', '', '', '', '', and ''. That is a count of .
• The desired event is an odd number which is the outcomes '', '', or ''. That is a count of .
• The Probability of event "odd number" = .
summary
Probability in Equal Chance Experiments : The number of outcomes in the sample space is .
The outcomes in sample space have equal chance.
The desired event is one of outcomes.
The probability = .
Outline
The outline of material to learn "basics of statistics and probability" is as follows.
Note: Click here for detailed outline of "Basics of Statistics and Probability"
• Introduction
→ Introduction to Statistics
→ Organizing Data : Tally Table
→ Pictograph
→ Bargraph
• Data Analysis
→ Cumulative Frequency
→ Representative Values of Data
→ Central Tendencies
→ Bargraphs & Piecharts
• Probability Fundamentals
→ Predicting Future
→ Random Experiment
→ Probability
→ Standard Experiments
• Statistics Grouped Data
→ Grouped Data
→ Probability in Grouped Data
→ Class Parameters of Grouped Data
→ Methods to find Mean of Grouped data
→ Mode of Grouped data
→ Median of Grouped Data