
what you'll learn...
overview
In this page, class interval and class mark of grouped data is explained with some examples.
class interval
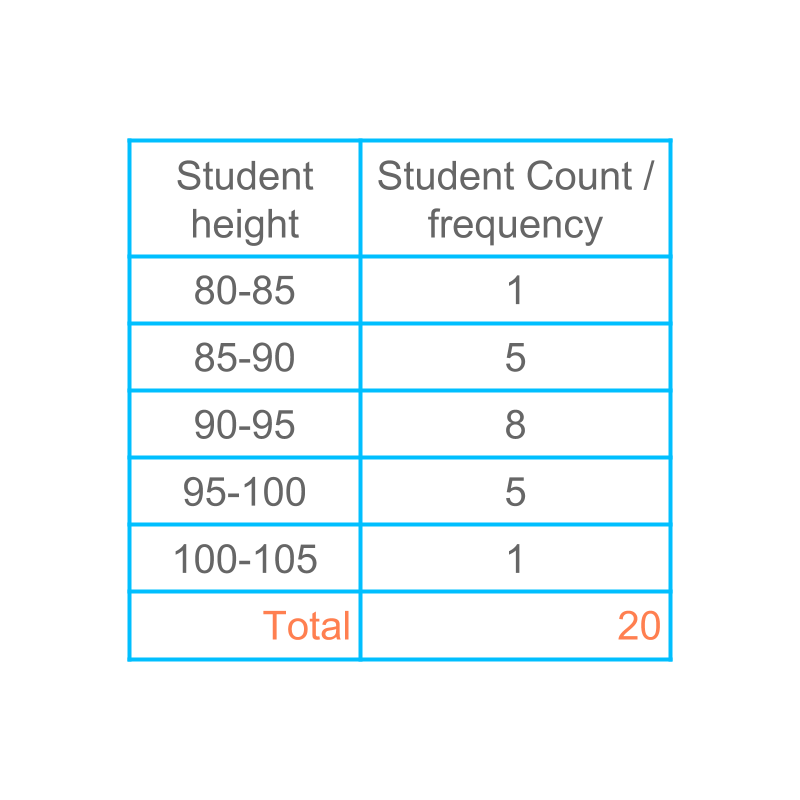
Consider the data given in the table. The height of students are listed with number of students within the height range.
The number of students for each of the data value is called the frequency of that data value.
For example, the frequency of the class to is .
The range of the given data is to .
In the given grouped data, the range to is divided into classes.
The five classes are
• student height from to
• student height from to
• student height from to
• student height from to
• student height from to
Each of the classes is of the size . This size of division or the range of one class, is called the "class interval".
The word "interval" means: gap; space between two things.
class mark
In the given grouped data, the range to is divided into classes.
The center point of each class interval is class mark of that class.
• Class mark of is
• Class mark of is
• Class mark of is
• Class mark of is
• Class mark of is
The word "mark" means: visible impression; indication of something.
Note that, the actual data values are not retained when the data is grouped into classes. The class mark is considered to be the representative value for all the grouped data in a class interval.
For example, the values of and are entered in the class to . If the values are to be used for some computation (like computing mean), then instead of the actual values, the class mark is used in their place.
summary
This size of division or the range of one class, is called the "class interval".
The center point of each class interval is class mark of that class.
Outline
The outline of material to learn "basics of statistics and probability" is as follows.
Note: Click here for detailed outline of "Basics of Statistics and Probability"
• Introduction
→ Introduction to Statistics
→ Organizing Data : Tally Table
→ Pictograph
→ Bargraph
• Data Analysis
→ Cumulative Frequency
→ Representative Values of Data
→ Central Tendencies
→ Bargraphs & Piecharts
• Probability Fundamentals
→ Predicting Future
→ Random Experiment
→ Probability
→ Standard Experiments
• Statistics Grouped Data
→ Grouped Data
→ Probability in Grouped Data
→ Class Parameters of Grouped Data
→ Methods to find Mean of Grouped data
→ Mode of Grouped data
→ Median of Grouped Data