
what you'll learn...
overview
In this page,the mean, median, mode of a data is introduced with examples.
• Mean is the value when the data is evenly distributed to all the values.
• Median is the value that has equal number of smaller and larger data values in the given data.
• Mode is the value that is repeated most number of times in the data.
recap
We have studied about representation of data in
• tally marks
• tabular form
• pictograph
• bar-graph
All these representations help to visualize and understand the data.
predict value of data
Consider the data : The height values of five students from a class are given below in centimeters.
, , , , .
All these students are of the same age.
Another student of the same age is joining the class. Using the above data, one can say that, the new student will be about the same height as the current students, little more or less.
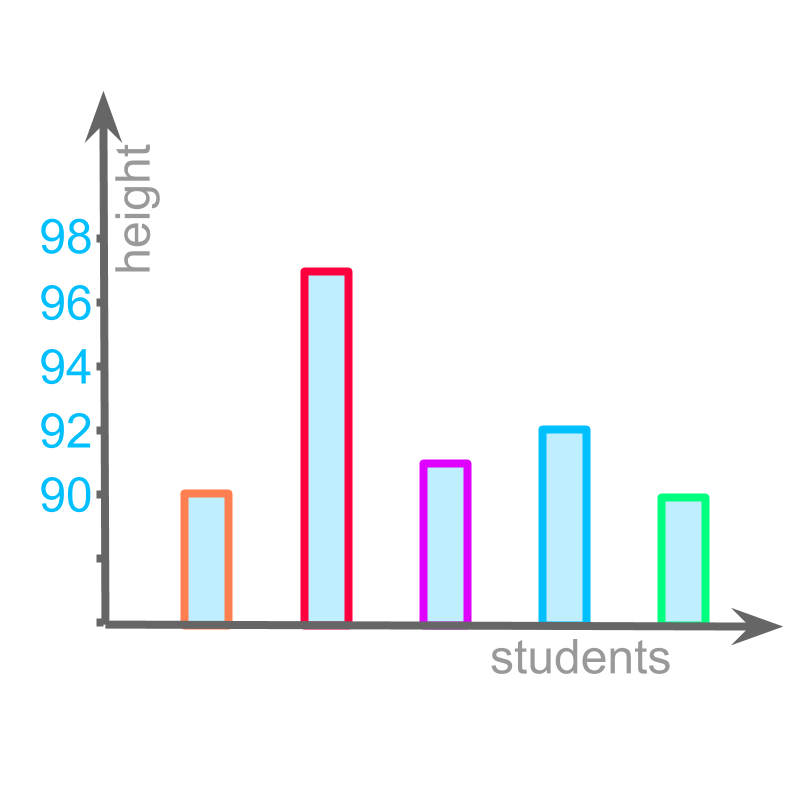
The data is used to predict the height of student of the same age. Instead of giving the entire data, the data can be summarized.
To summarize the data, there are three possible solutions.
1. Mean: The value when all data are evenly distributed among the given data values. This involves addition and division.
2. Median: The value that is in the middle of the increasing or decreasing order of the given data values. This involves arranging in increasing or decreasing order.
3. Mode: The data value that is repeating most number of times in the given data values. This involves counting.
Each of these three is explained with the given dataset.
average
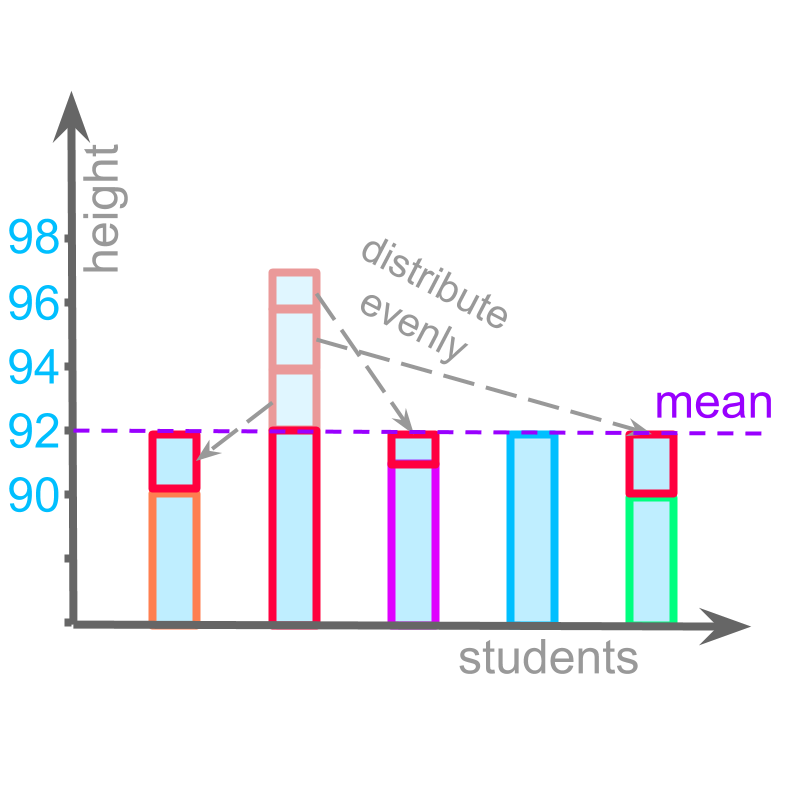
The height values of students from a class are given below in centimeters.
, , , , .
The given values are added and divided by the number of values
mean
This is understood as "evenly distributing the values". This is illustrated in the figure.
This value is represented as the "mean" of the given data.
The word "mean" has a meaning, value of each data point when all are grouped together and evenly distributed among them.
Mean is also called arithmetic mean.
Mean is also called as average by some authors.
Generally, average includes all three measures mean, median, and mode. These three measures are also called as central tendencies.
right in the middle
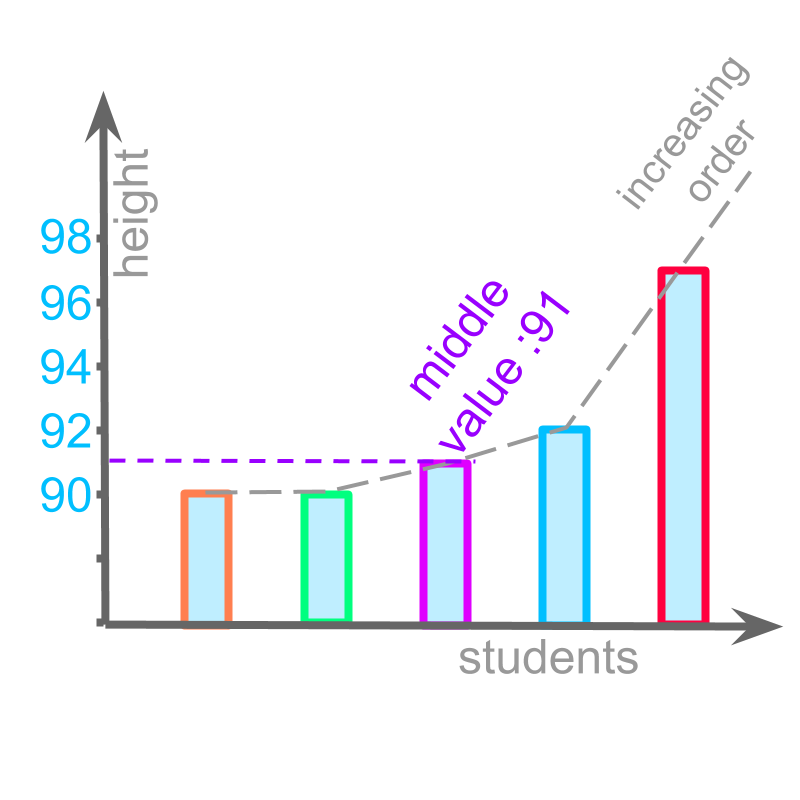
The height values of students from a class are given below in centimeters.
, , , , .
The given values are arranged in increasing order and middle one is found.
median
This is understood as "removing equal number of data values that are smaller and larger". This is illustrated in the figure.
This is represented as "median" of the data.
The word "median" means: the data value at the middle with equal number of smaller and larger data values.
most number of data points
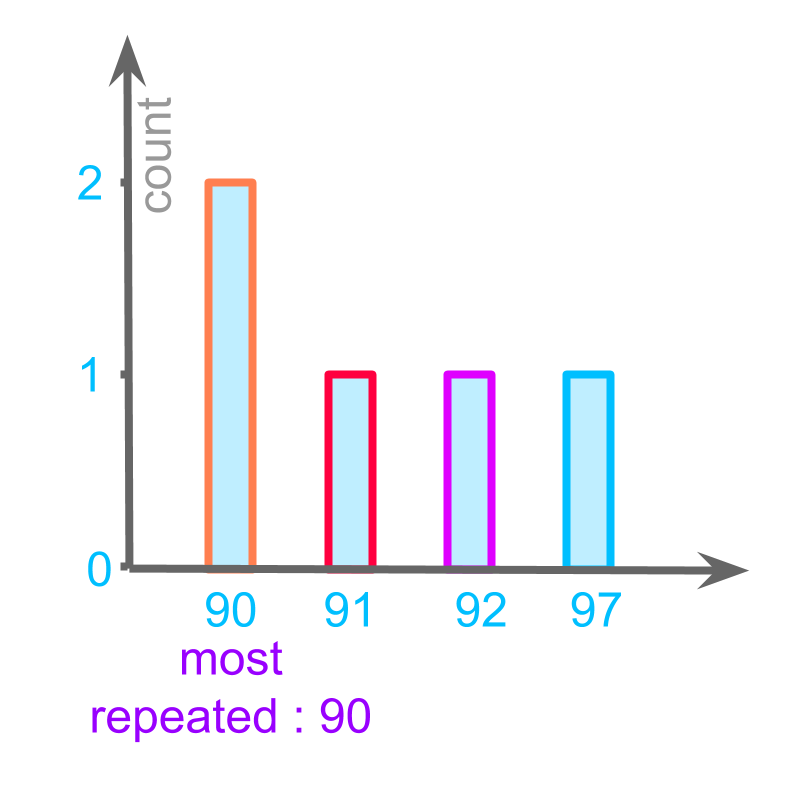
The height values of students from a class are given below in centimeters.
, , , , .
The values that is repeating most number of times is found.
is repeated twice, and other data points , , are repeated only once. So,
mode
This is understood as "the value that repeats most number of times". This is illustrated in the figure.
This value is represented as the "mode" of the data.
The word "mode" means: most repeating data value.
summary
Mean : The value when the data is evenly distributed to all the values.
Simplified Procedure to calculate Mean : Add all the data values and divide the sum by the number of data-points.
Median : The value that has equal number of smaller and larger data values in the given data.
Simplified Procedure to calculate Median : Arrange the data values in ascending order and find the value in the middle.
Mode : The value that is repeated most number of times in the data.
Simplified Procedure to calculate Mode : Count the number of times a data-point repeats and find the data value with most repetition.
Outline
The outline of material to learn "basics of statistics and probability" is as follows.
Note: Click here for detailed outline of "Basics of Statistics and Probability"
• Introduction
→ Introduction to Statistics
→ Organizing Data : Tally Table
→ Pictograph
→ Bargraph
• Data Analysis
→ Cumulative Frequency
→ Representative Values of Data
→ Central Tendencies
→ Bargraphs & Piecharts
• Probability Fundamentals
→ Predicting Future
→ Random Experiment
→ Probability
→ Standard Experiments
• Statistics Grouped Data
→ Grouped Data
→ Probability in Grouped Data
→ Class Parameters of Grouped Data
→ Methods to find Mean of Grouped data
→ Mode of Grouped data
→ Median of Grouped Data