
what you'll learn...
overview
In this page, the following standard random experiments are explained.
• tossing a coin
• rolling a dice
• picking a ball of a color from a box
In each of these, the statistical methods to predict the outcome of an experiment requires large effort and small variations in data can cause errors in the prediction. So the possible outcomes are theorized as having equal chances and the probability of an outcome is defined.
recap
In the topic Probability of an Event in Random Experiments, we have studied the following.
Dropping a ball is not a random experiment. If a ball is dropped times, it will always hit the floor.
Tossing a coin is a random experiment.
Let us say, when the coin was tossed once, it landed 'heads' up. The result does not indicate in anyway that the result will be 'heads' whenever the coin is tossed. It can either be 'heads' or 'tails'. That is why tossing-a-coin is called a random experiment.
That is, a random experiment has a number of possible outcomes. A random experiment, when performed, results in one of the possible outcomes.
In this chapter, the following random experiments are considered
• tossing a coin : A coin with 'heads' or 'tails' is flipped. The face seen on top is the outcome of the experiment.
• rolling a dice : A dice has faces marked with numbers to . The dice lands with one of the faces up. The outcome is the number on the face that is facing up.
• picking a ball from a box : A box has a number of red and blue balls. A person picks a ball without looking into the box. The color of the ball is the outcome of the experiment.
tossing a coin
Consider tossing a coin. From the knowledge we have gained in statistics, the right way to predict the outcome, is conduct the experiment a large number of times and collect data. Based on the data one can predict. An example is illustrated below.
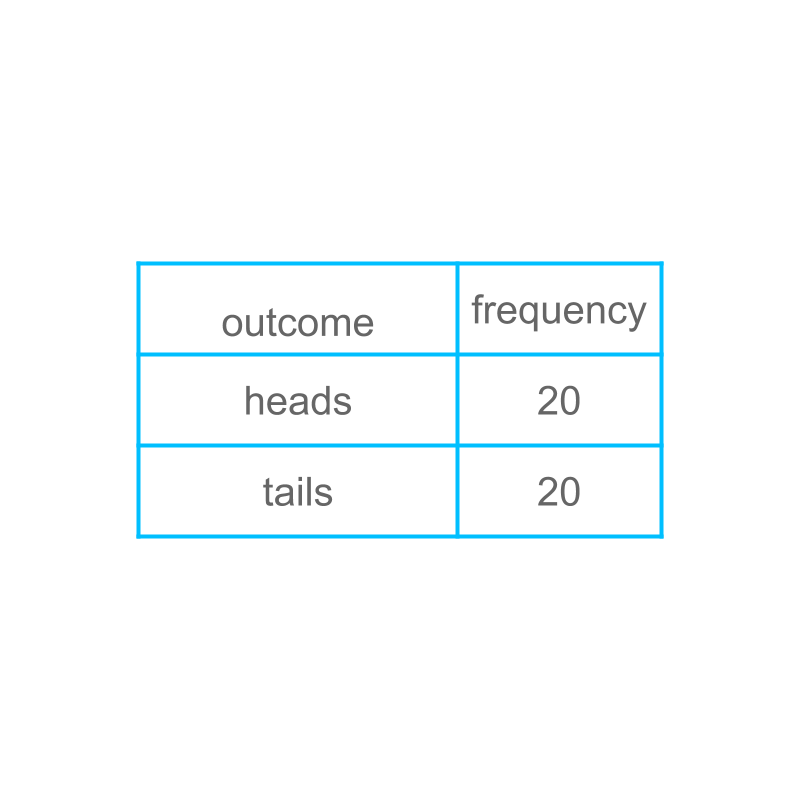
Considering tossing a coin. We have conducted the experiment times and collected the data. The prediction goes like the following
• If the coin is tossed times, the outcome 'heads' will occur times
• If the coin is tossed times, the outcome 'heads' will occur times
• If the coin is tossed time, the outcome 'heads' will be predicted as of times chance.
This is the fundamental part in probability and this is explained in detail below.
variations
Considering tossing a coin.
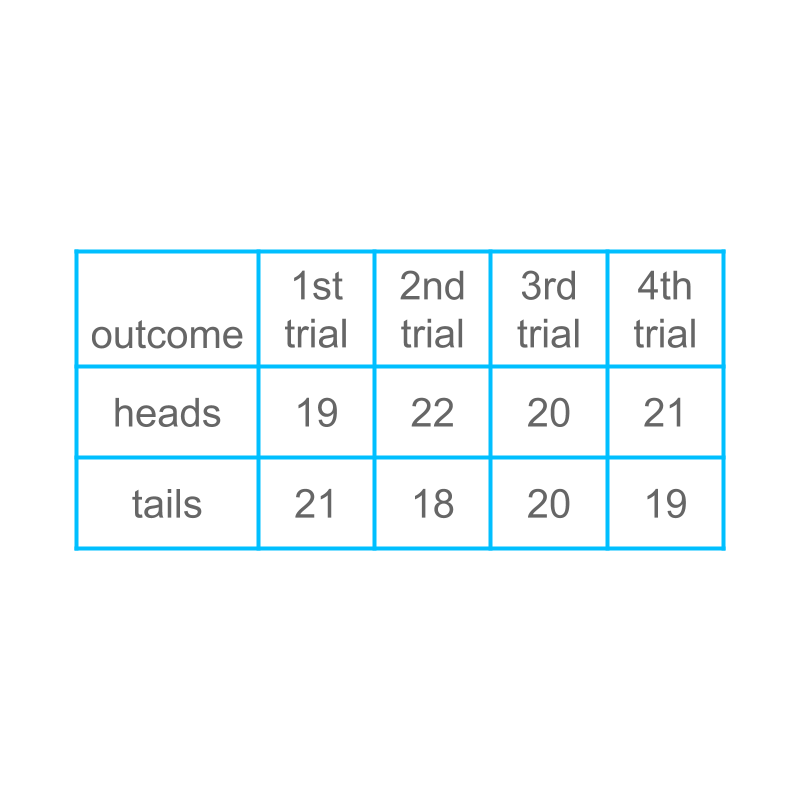
The figure shows examples of conducting the experiment many times. There is small variation in the data.
It is noted that, in random experiments, the data will have errors due to variations.
Since, the data has errors due to variations, the data is not used to define the probability of the outcome. Instead, the two outcomes are theorized to be having equal chance and the data is used to verify if that assumption is correct.
data or theory
To find the probability of a possible outcome in a random experiment, two possible methods are used.
• repeat the experiment a large number of times such that any error due to variations is negligibly low.
• theoretically figure-out that the possible outcomes have equal chance and calculate the probability accordingly.
Probability = number of outcomes in the desired event / number of outcomes in the sample-space.
large number of trials
Considering tossing a coin.
The figure shows examples of conducting the experiment many times. There is small variation in the data.
Theoretically, the following is derived.
• the sample space is 'heads' and 'tails'
• The two outcomes in the sample space have equal chance
• It is expected that if the experiment is conducted large number of trials, then the difference between number of 'heads' and 'tails' will be negligibly small.
• Therefore, probability of 'heads' is and for the 'tails' is
honest
A coin that adheres to this theorization of equal probability is called an honest coin.
It is assumed that coins used in random experiments are honest coins. If that assumption is not valid, then it is explicitly given that the coin is biased.
rolling a dice
Consider the random-experiment: Rolling a dice. Without conducting the experiment and looking at the data that has errors because of variations, we conclude the following.
• the sample space is , , , , , and
• all the six outcomes in the sample space have equal chance.
• so the probability of is and so on for other events.
A dice adhering to this theorization of equal probability is called an honest dice.
picking a color
Consider the random experiment: Picking a ball at random from a box of 3 red balls and 2 blue balls. Without conducting the experiment and looking at the data that has errors because of variations, we conclude the following
• The sample space is 'red1', 'red2', 'red3', 'blue1', and 'blue2' color balls.
• The five balls have equal chance.
• The desired outcome or the event is a red ball. That can be one of in the sample space.
• The probability of picking a red ball = count of possible outcomes in desired event / count of possible outcomes in the sample space
Probability of picking a red ball =
summary
Honest random experiment : Random experiments, when they are conducted, result in variation in outcome probabilities depending on various parameters. A honest random experiment is the hypothetical experiment that exhibits outcome probabilities equal to the theorized outcome probabilities.
A coin that adheres to the theorization of equal probability between heads and tails is called an honest coin.
A dice that adheres to the theorization of equal probability between faces is called an honest dice.
Outline
The outline of material to learn "basics of statistics and probability" is as follows.
Note: Click here for detailed outline of "Basics of Statistics and Probability"
• Introduction
→ Introduction to Statistics
→ Organizing Data : Tally Table
→ Pictograph
→ Bargraph
• Data Analysis
→ Cumulative Frequency
→ Representative Values of Data
→ Central Tendencies
→ Bargraphs & Piecharts
• Probability Fundamentals
→ Predicting Future
→ Random Experiment
→ Probability
→ Standard Experiments
• Statistics Grouped Data
→ Grouped Data
→ Probability in Grouped Data
→ Class Parameters of Grouped Data
→ Methods to find Mean of Grouped data
→ Mode of Grouped data
→ Median of Grouped Data