
what you'll learn...
overview
In this page,the following are introduced with examples
• range of data : The possible values within a lower limit and an upper limit is called the range of data.
• frequency of a data-point : The number of times a data value is repeated is the frequency of the data.
• cumulative frequency : The number of times a data value or the data-values lower than that value is repeated, is the cumulative frequency at the data value.
recap
We studied about the following in the earlier pages.
Data : Collection of information is data.
eg: Height of students in cm -- , , , ,
Statistics is study of recording, representing, and analysis of data.
This topic goes into details of collecting and organizing data.
raw
Consider the data: Number of glasses of water students drink during the school time is given below.
2, 3, 1, 4, 1,
1, 2, 2, 1, 2,
3, 2, 2, 3, 5,
2, 5, 1, 1, 2,
2, 1, 3, 2, 2,
1, 2, 1, 2, 2,
3, 2, 2, 5, 4,
2, 1, 3, 1, 2
This form of data is called "raw data"
The word "raw" means: in the original form; not modified for any purpose.
tally
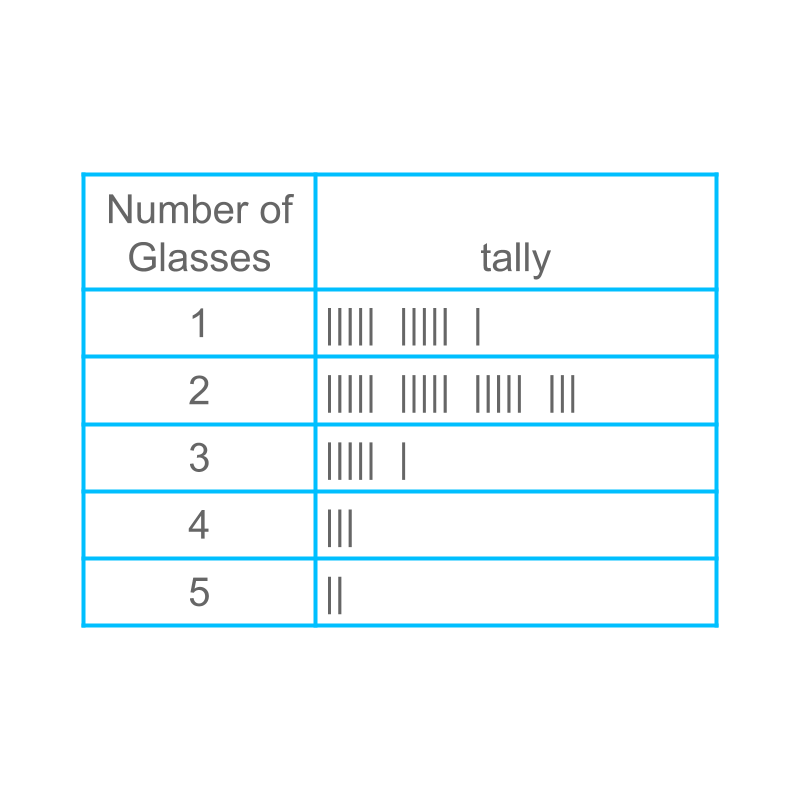
The figure illustrates the tally marks for the given data. This is a suitable representation when recording the data
table
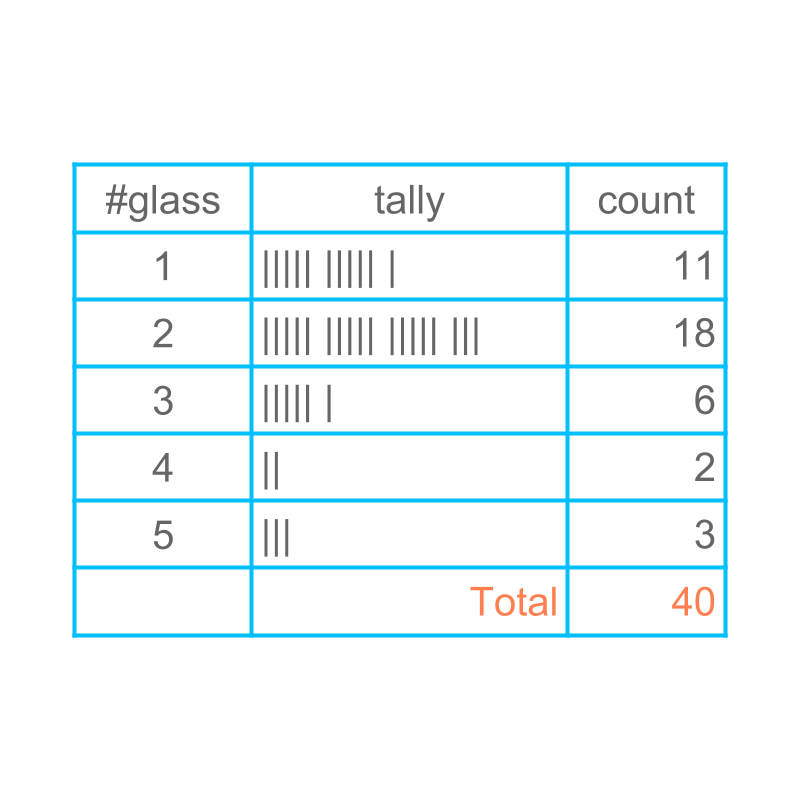
The recorded data is converted into table form and this is illustrated in the figure.
From the table, one can find that, the minimum number of glass of water is .
From the table, one can find that, the maximum number of glass of water is .
between start and end
In a given data, the values have a minimum and maximum. All the data values are within the minimum and maximum. This is called "range" of the data. In the given example, the range of data is to .
The word "range" means: the possible values within a lower limit and an upper limit.
look-up
Consider the data: Number of glasses of water students drink during the school time.
One wants to find, the number of students who had glasses-of-water. From the table, the row where the number of glasses of is chosen and the column "count" provides the answer .
rate
In a data, the data-values are counted and the number of times a data-value repeats is called "frequency" of the data-value.
In the given example,
• the frequency of is
• the frequency of is
• the frequency of is
• the frequency of is
• the frequency of is
The word "frequency" means the count or rate at which something happens.
successive addition
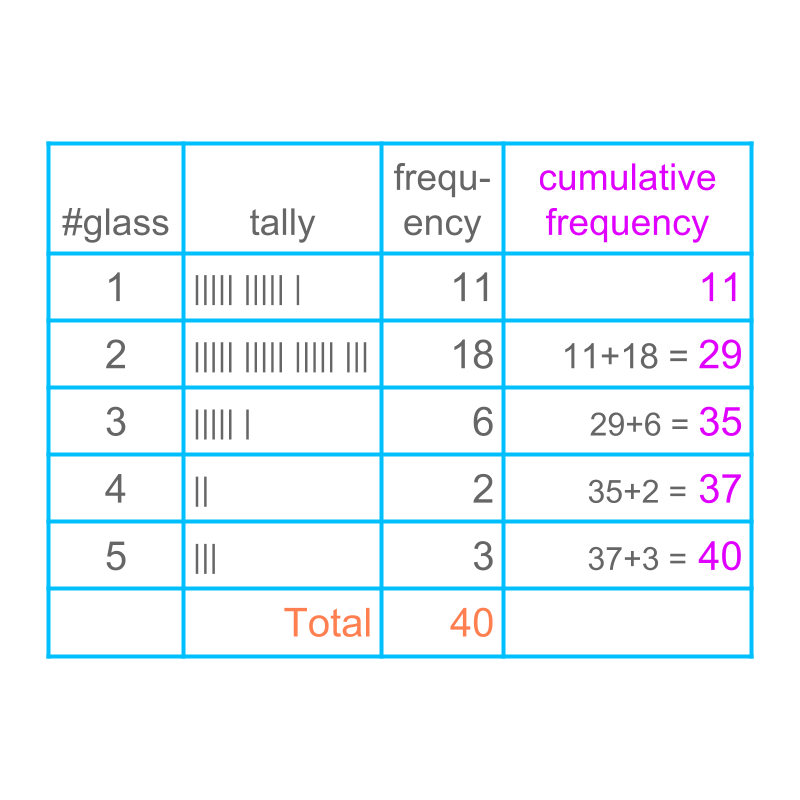
Considering the given data: one can find that the number of students who had glasses or less is .
In a data set, the data-values are ordered in ascending order. The count of data-values that are less than or equal to a specific data value is called the "cumulative frequency" at the specific data-value.
In the given example,
• the cumulative frequency at is
• the cumulative frequency at is
• the cumulative frequency at is
• the cumulative frequency at is
• the cumulative frequency at is
The word "cumulative" means: increasing by successive addition.
summary
Range of data : The possible values within a lower limit and an upper limit is called the range of data.
Frequency of a data point : The number of times a data value is repeated is the frequency of the data.
Cumulative Frequency : The number of times a data value or the data-values lower than that value is repeated, is the cumulative frequency at the data value.
Outline
The outline of material to learn "basics of statistics and probability" is as follows.
Note: Click here for detailed outline of "Basics of Statistics and Probability"
• Introduction
→ Introduction to Statistics
→ Organizing Data : Tally Table
→ Pictograph
→ Bargraph
• Data Analysis
→ Cumulative Frequency
→ Representative Values of Data
→ Central Tendencies
→ Bargraphs & Piecharts
• Probability Fundamentals
→ Predicting Future
→ Random Experiment
→ Probability
→ Standard Experiments
• Statistics Grouped Data
→ Grouped Data
→ Probability in Grouped Data
→ Class Parameters of Grouped Data
→ Methods to find Mean of Grouped data
→ Mode of Grouped data
→ Median of Grouped Data