
what you'll learn...
overview
In this page, the pictograph representation of Data is explained with simple examples.
• A visually pleasing representation of data with pictures is a pictograph.
visually pleasing
We studied that, data can be represented in tally marks or in tabular form.
Such representation is used to understand details like which row is large, which row is empty, etc.
The data can be given using a friendly and artistic form with pictures. It is widely used in newspapers and other similar publications. It is visually pleasing to the readers.
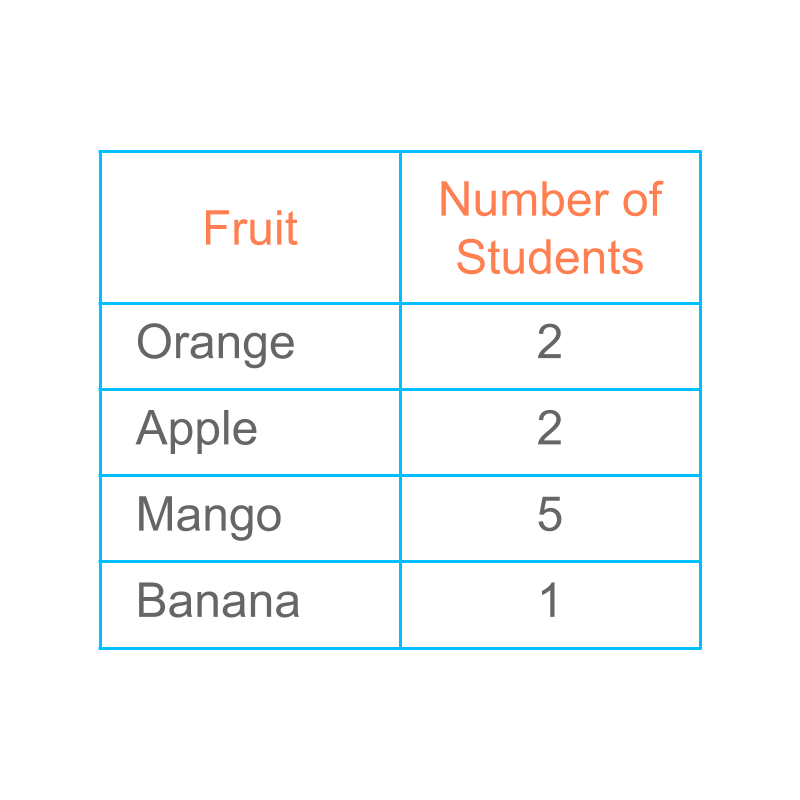
Consider the data
orange 2
apple 2
mango 5
banana 1
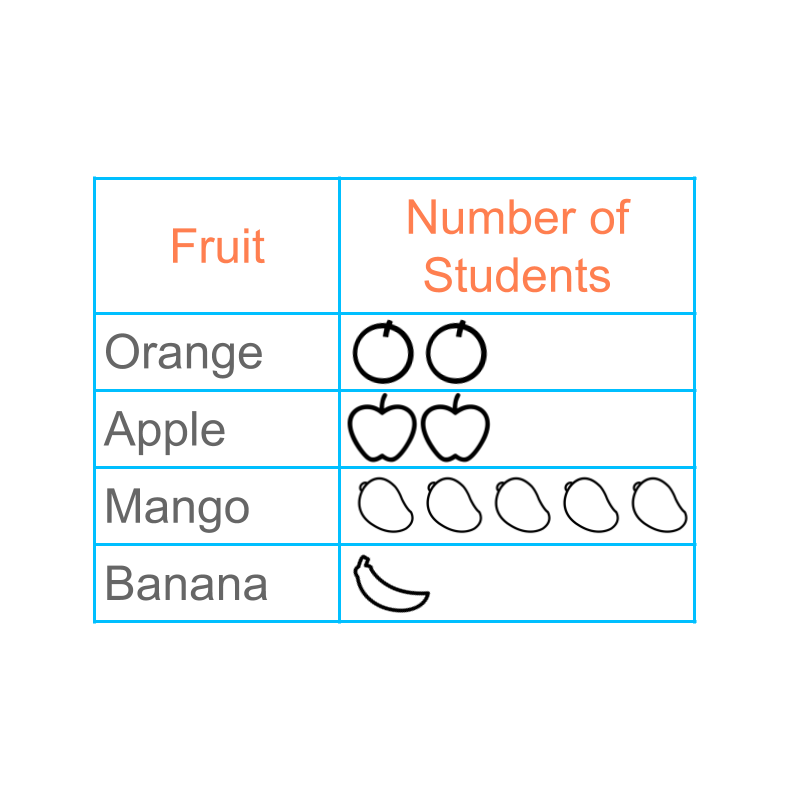
The figure depicts a "pictograph" of the data.
The word "pictograph" means: data represented with pictures
scale
Earlier, we learned about using tally-marks to represent data. Then, we understood that the tally-marks do not work well for large values in data. This lead to the tabular form of data.
Similarly, the pictograph in the present form will be very hard to represent large values.
Let us consider the data:
Orange :
Apple :
Mango :
Banana :
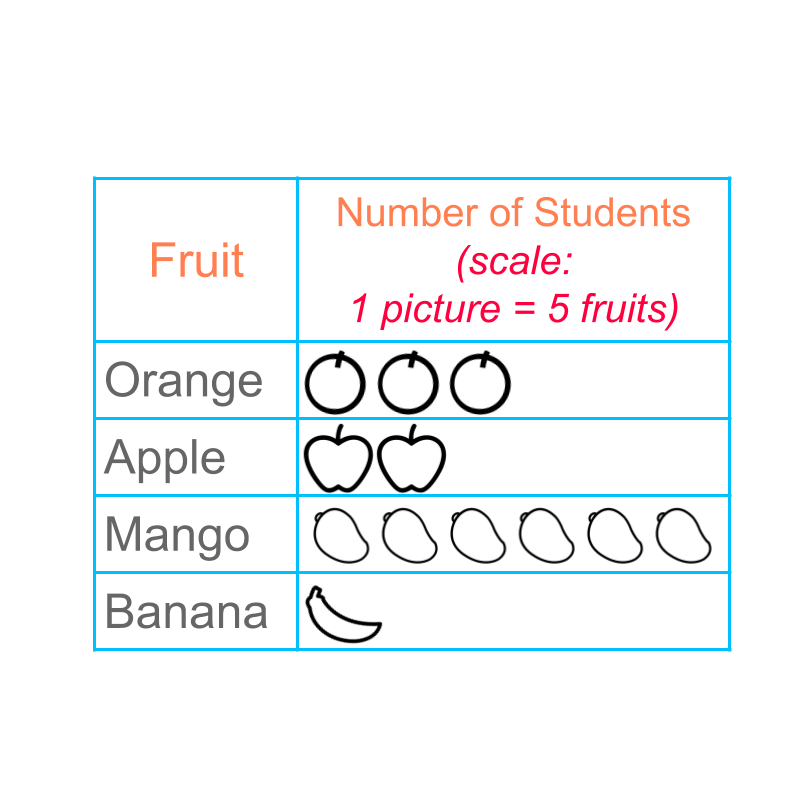
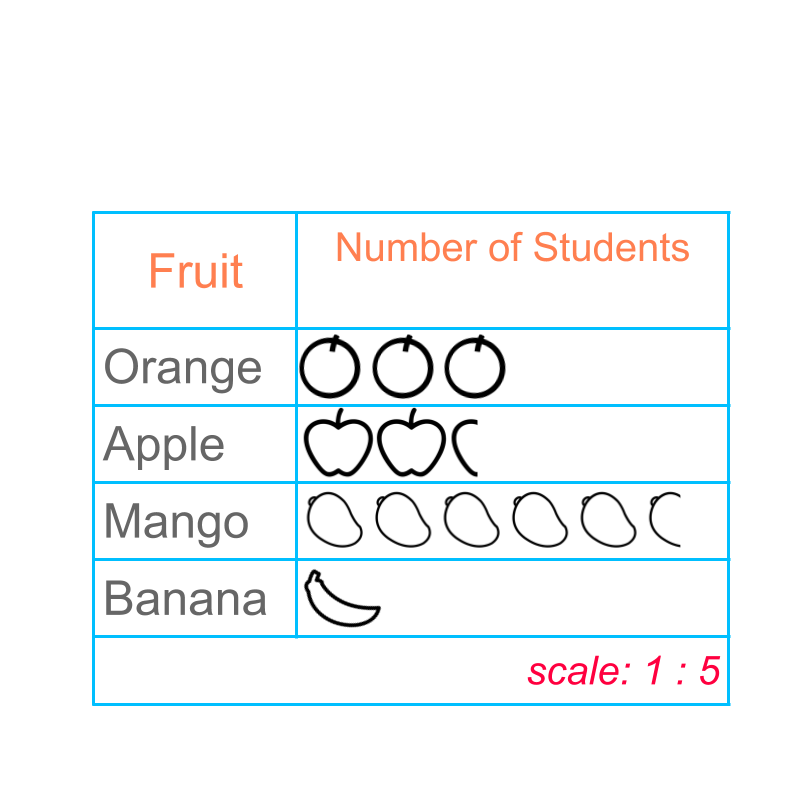
Instead of representing fruit with one picture, we can represent fruits with one picture. A pictograph with scale is given in figure.
Representing items with one picture is called "scale". The pictograph uses scale of to represent the data.
A scale of is used to represent the pictograph.
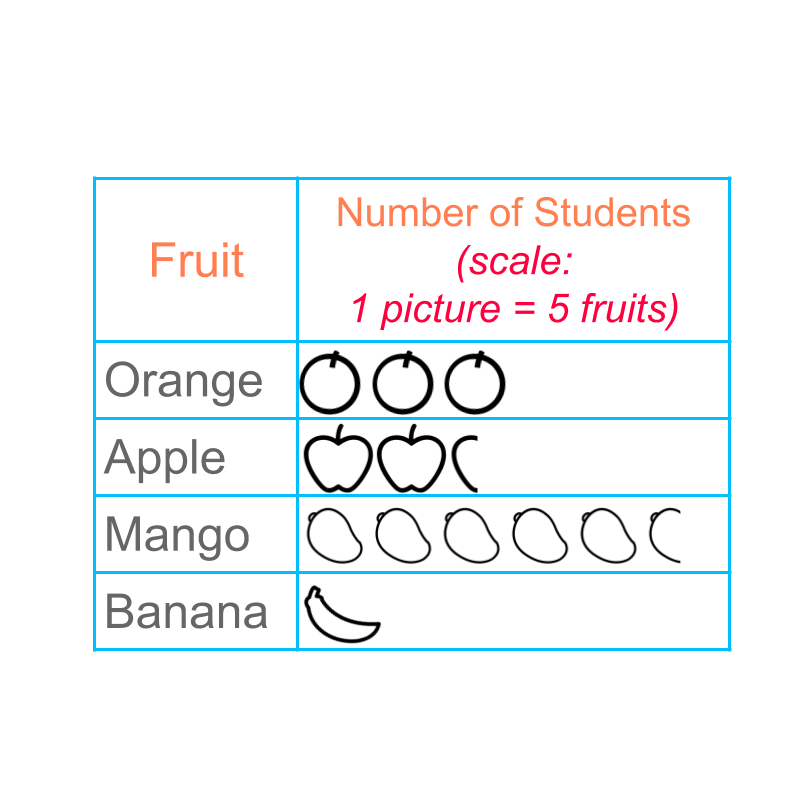
The number of apples is represented as , that is two full pictures and one part picture of apple.
Similarly the number of mangoes is represented.
If a person is provided with the pictograph only, he/she will not be able to find the data accurately. This form of pictograph is not accurate in reproducing the data. Users usually get an idea on which is large, which are comparable, and which is small.
summary
Pictograph : A visually pleasing representation of data with pictures is a pictograph.
Scaling in Pictograph : A pictograph with a specified scale that indicates the number for every picture.
Outline
The outline of material to learn "basics of statistics and probability" is as follows.
Note: Click here for detailed outline of "Basics of Statistics and Probability"
• Introduction
→ Introduction to Statistics
→ Organizing Data : Tally Table
→ Pictograph
→ Bargraph
• Data Analysis
→ Cumulative Frequency
→ Representative Values of Data
→ Central Tendencies
→ Bargraphs & Piecharts
• Probability Fundamentals
→ Predicting Future
→ Random Experiment
→ Probability
→ Standard Experiments
• Statistics Grouped Data
→ Grouped Data
→ Probability in Grouped Data
→ Class Parameters of Grouped Data
→ Methods to find Mean of Grouped data
→ Mode of Grouped data
→ Median of Grouped Data