
what you'll learn...
overview
In this page, computing mean, median, and mode using tally / table form of data is explained with examples.
recap
We studied the following example.
The heights of five students from a class are given below in centimeters.
, , , , .
Instead of providing the entire data, the data can be presented in some representative values.
The representative values we have studied earlier are Mean, Median, Mode.
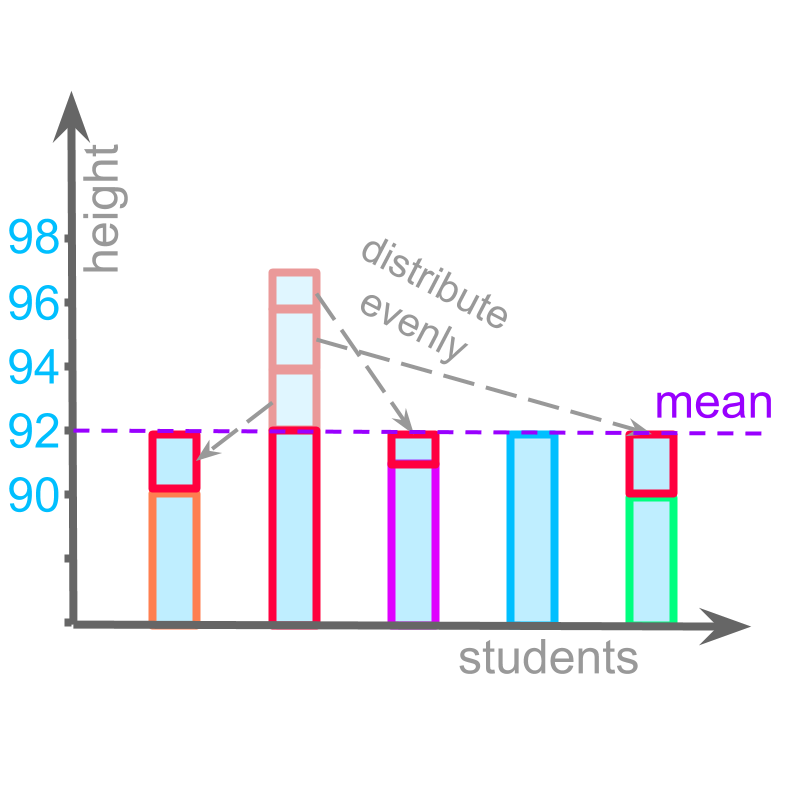
The mean of data , , , , is calculated by adding the data values and dividing the sum by the number of data-values.
mean
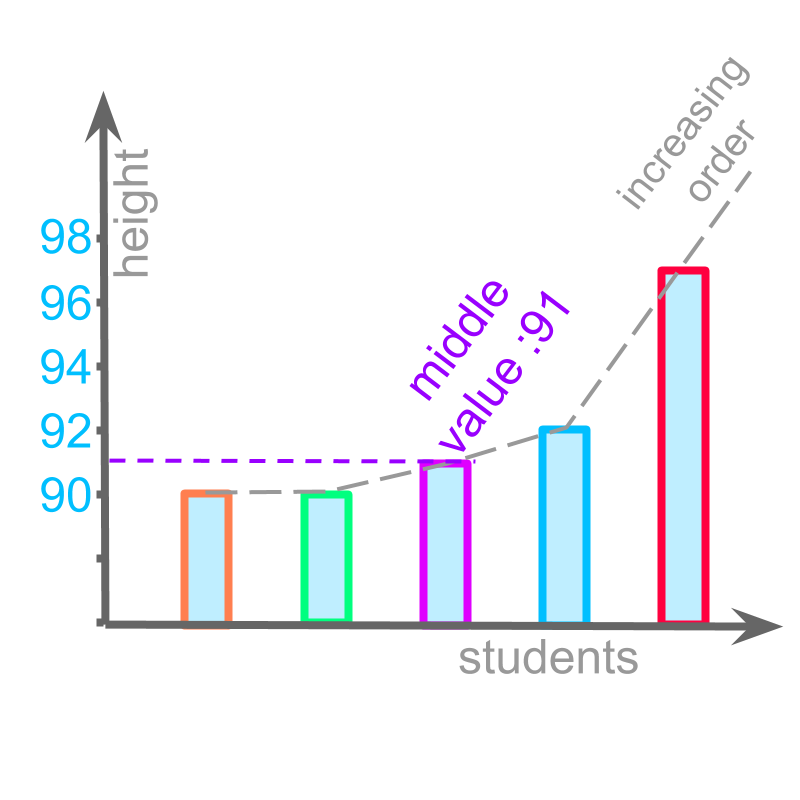
median of data , , , , , is calculated by arranging the data-values in ascending order and the value in the middle is the median.
median
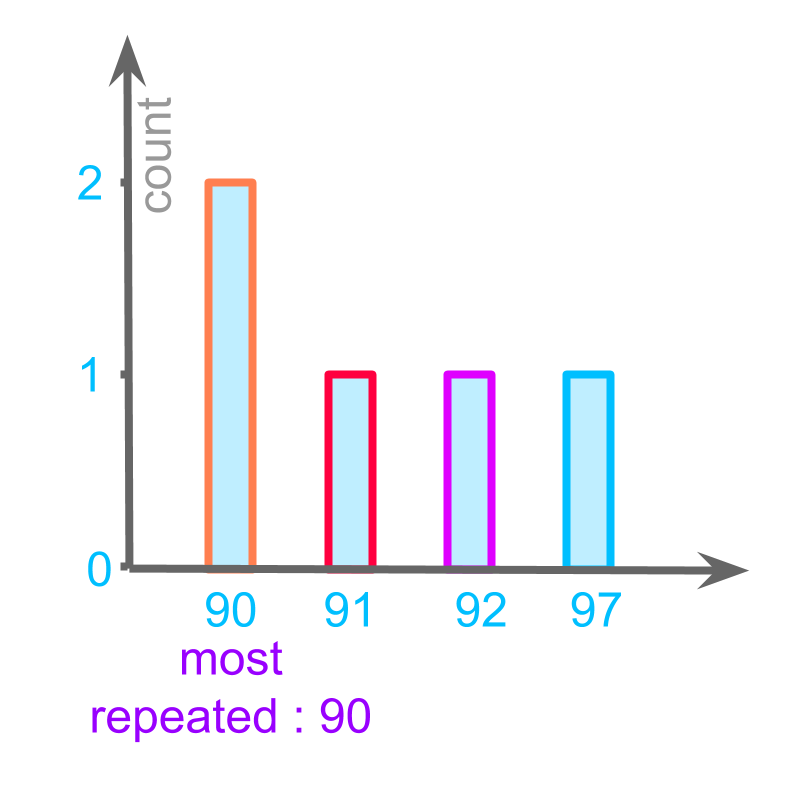
The mode of data , , , , is calculated by Counting the number of data-values for each data-value and the most repeated one is the mode.
is repeated twice, and other data points , , are repeated only once. So,
mode
nature of the average
The phrase "central tendencies" means: nature of being or bias of the average or middle.
Mean, Median, and Mode are central tendencies of the data.
Nature of the data is that it has large number of data-values.
Each of the central tendencies represents the data with a representative value.
simple example
Consider the data , , , , .
Mean is calculated by adding the data values and dividing the sum by the number of data values.
mean by definition
When the data is in tabular form, we have the data value and the count (number of times the data value repeats) of data.
: count
: count
: count
: count
The mean can be calculated as "sum of (value multiplied by count) divided by sum of counts".
mean from tabular form of value-count
mean in tabular form
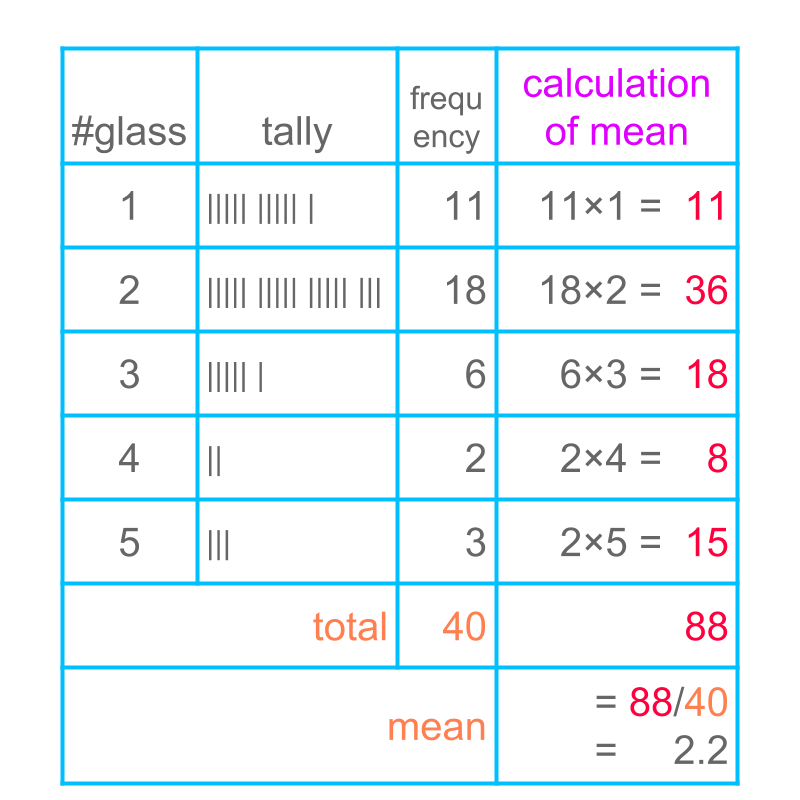
Consider the data: Number of glasses of water students drink during the school time.
The figure illustrates tally and tabular form of data.
Calculation of mean is illustrated in the figure. This calculation results in
mean
The last column shows, data-value multiplied by its frequency.
In the row marked as "total" the frequency is added and the values in last column are added.
In the row marked as "mean", the sum of data-value multiplied by frequency is divided by the sum of frequency.
median in tabular form
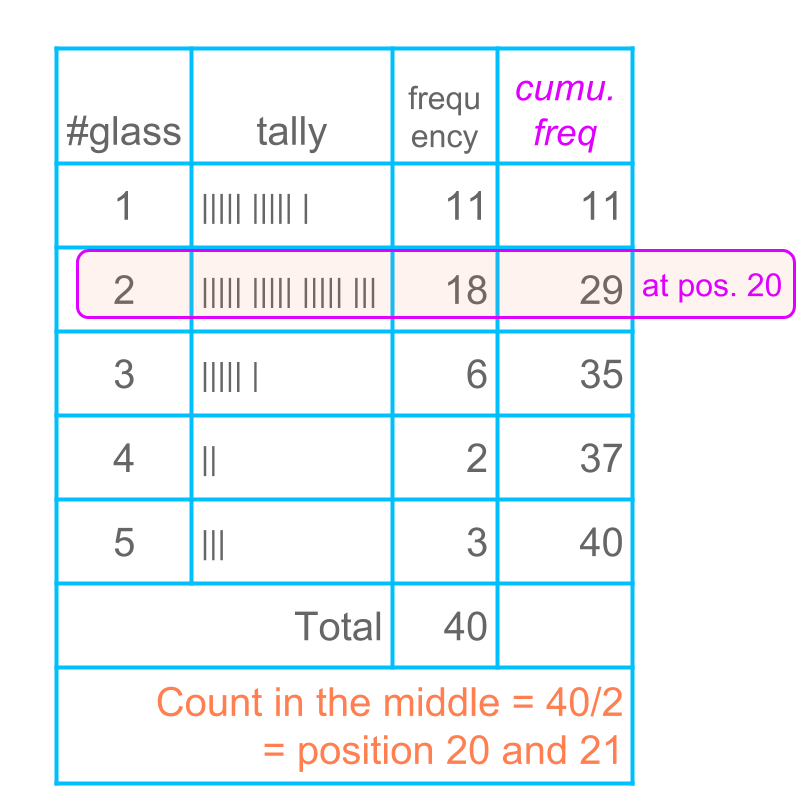
Consider the data: Number of glasses of water students drink during the school time.
The figure illustrates tally and tabular form of data.
Calculation of median is illustrated in the last column. This calculation result in
median
The last column shows the cumulative frequency.
In the row marked as "total", the frequency is added.
In the row marked as "count in the middle", the total is divided by and the center position is and .
The last column "cumulative frequency" is examined to find the data-value at position . The data value is .
The median value of the given data is .
mode
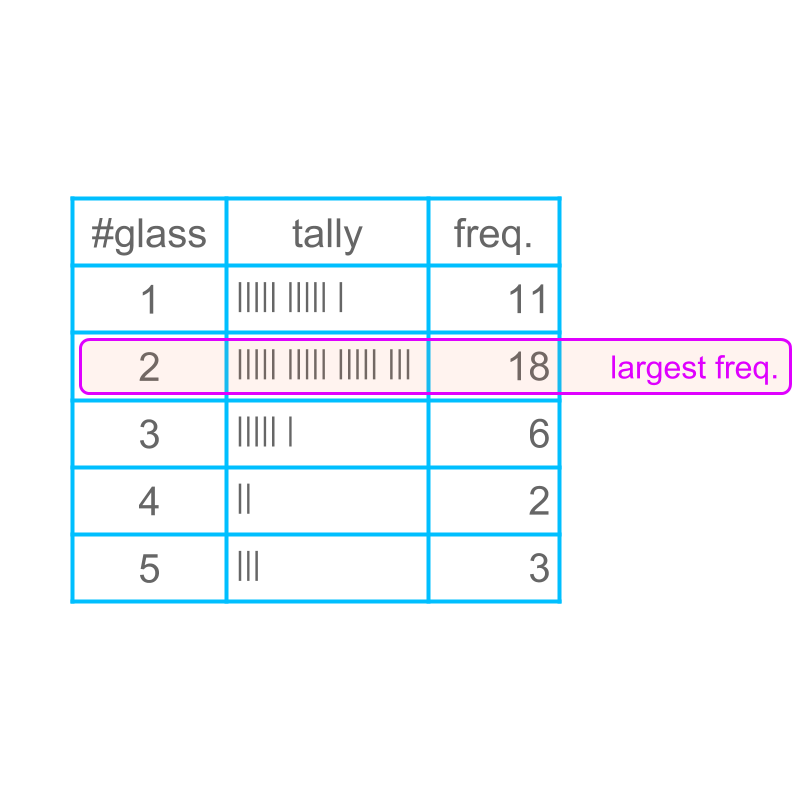
Consider the data: Number of glasses of water students drink during the school time.
The figure illustrates tally and tabular form of data. Calculation of mode is illustrated in the last column. This calculation results in
mode
The last column provides the frequency.
The largest frequency value is selected and highlighted. The corresponding data value is the mode of the data.
The mode of the given data is .
summary
Calculating mean in tabular form
Calculating median in tabular form
Calculating mode in tabular form
Outline
The outline of material to learn "basics of statistics and probability" is as follows.
Note: Click here for detailed outline of "Basics of Statistics and Probability"
• Introduction
→ Introduction to Statistics
→ Organizing Data : Tally Table
→ Pictograph
→ Bargraph
• Data Analysis
→ Cumulative Frequency
→ Representative Values of Data
→ Central Tendencies
→ Bargraphs & Piecharts
• Probability Fundamentals
→ Predicting Future
→ Random Experiment
→ Probability
→ Standard Experiments
• Statistics Grouped Data
→ Grouped Data
→ Probability in Grouped Data
→ Class Parameters of Grouped Data
→ Methods to find Mean of Grouped data
→ Mode of Grouped data
→ Median of Grouped Data