
what you'll learn...
overview
In this page, finding mode of grouped data is explained with some examples.
The formula is derived for students to understand how mode is calculated -- this is not available in other books.
recap
Mode of a data is, the value that is repeated the most number of times in the data.
Consider the data: Number of pens carried by 10 students.
The mode of the data is ".
To compute the mode, the number of times a data value is repeated is calculated.
is repeated twice
is repeated times
is repeated twice
is repeated once
From this, it is concluded that is repeated the most and so is the mode of the given data.
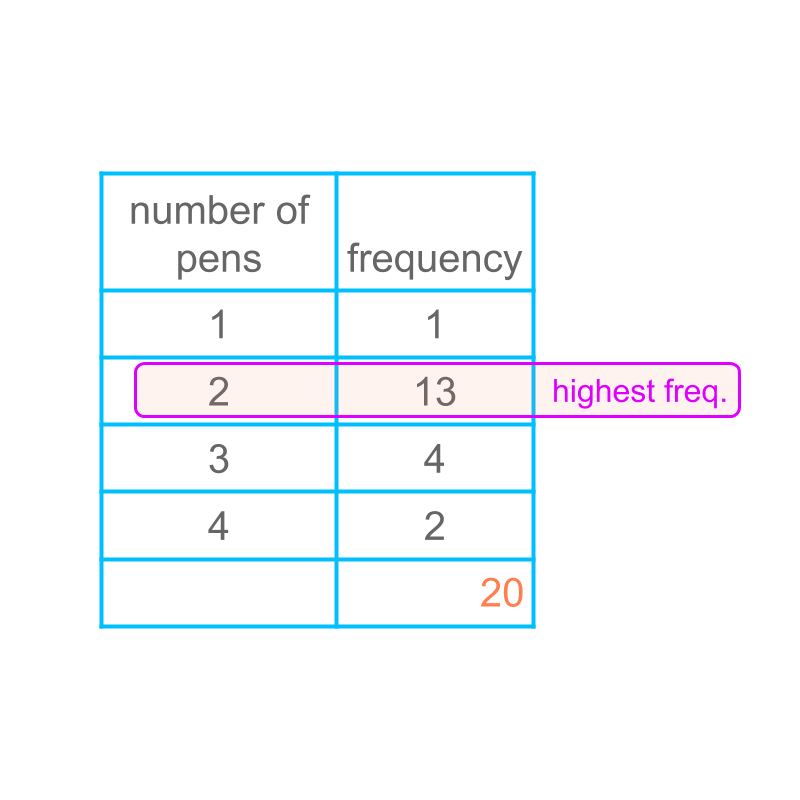
Consider the data given in the table in frequency form. The mode is the data value having highest frequency.
The mode is .
mode of grouped data
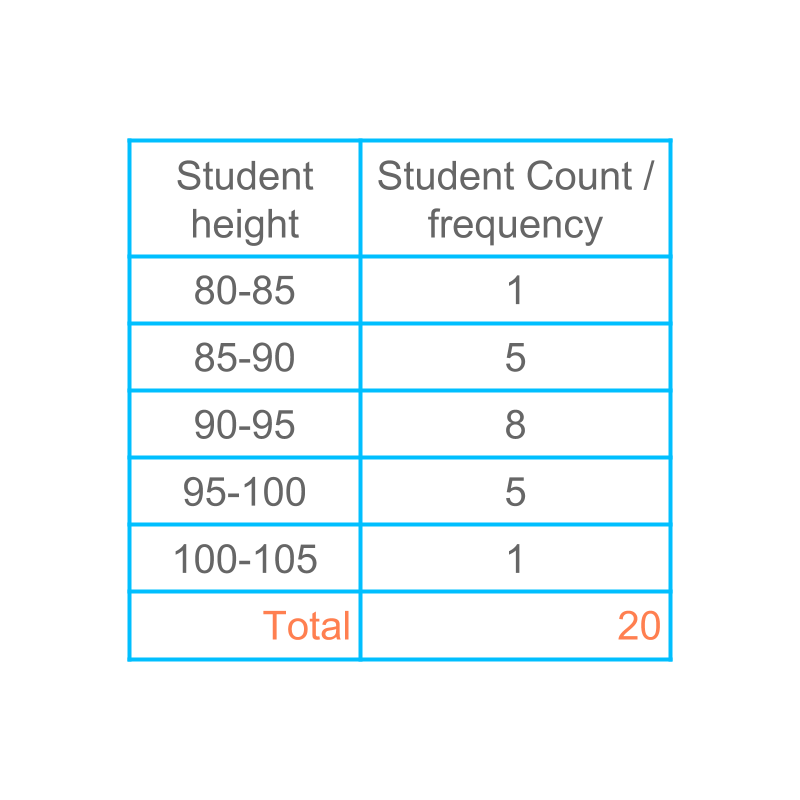
Consider the grouped data given in the table. Let us see how to find the mode of the grouped data.
Figuring out the mode of grouped data is given in table.
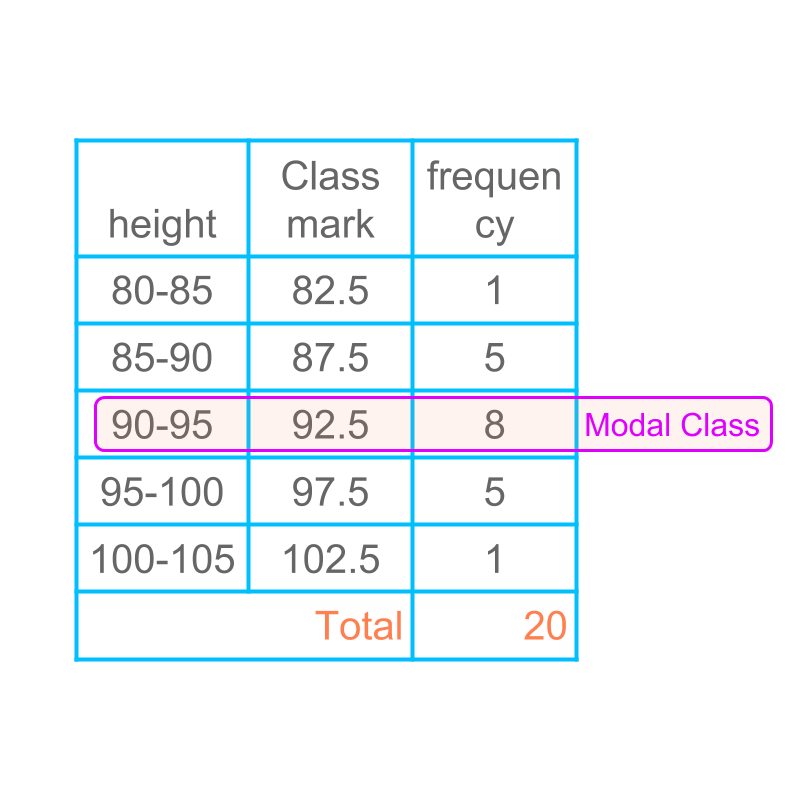
In grouped data, the class with the highest frequency is the modal class. There are three possibilities to provide the mode of the data.
The modal class is specified for the data. This is very broad range to use in applications.
The class mark of the modal class is specified for the data. This value is not accurate enough to use in applications.
The value at which the frequency distribution has a maximum within the class interval is calculated. This provides a good approximation to the mode of the data.
The first two are not used as mode of the data. Finding mode as per the third method is explained in the next pages.
better estimate of mode of grouped data
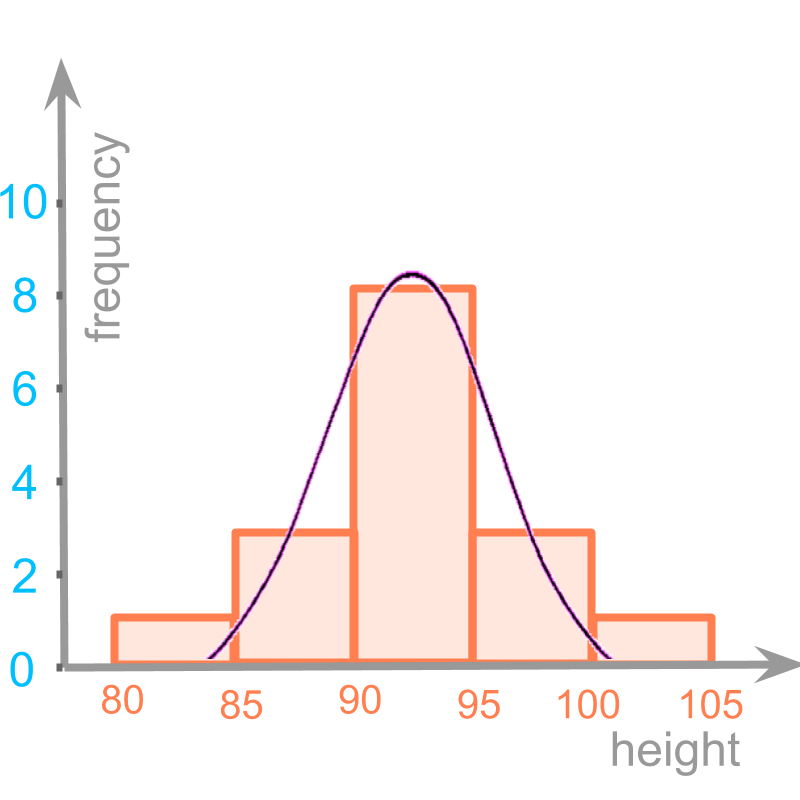
Consider the histogram of grouped data.
It is noted that the underlying distribution is a continuous curve. The grouped data partitions into intervals.
Mode cannot be computed using the values on the curve, as the available information is only the grouped data.
Mode is to be computed using the values of histogram. Though we know that the distribution is a continuous curve, the values on the curve is not known. We only have the histogram values.
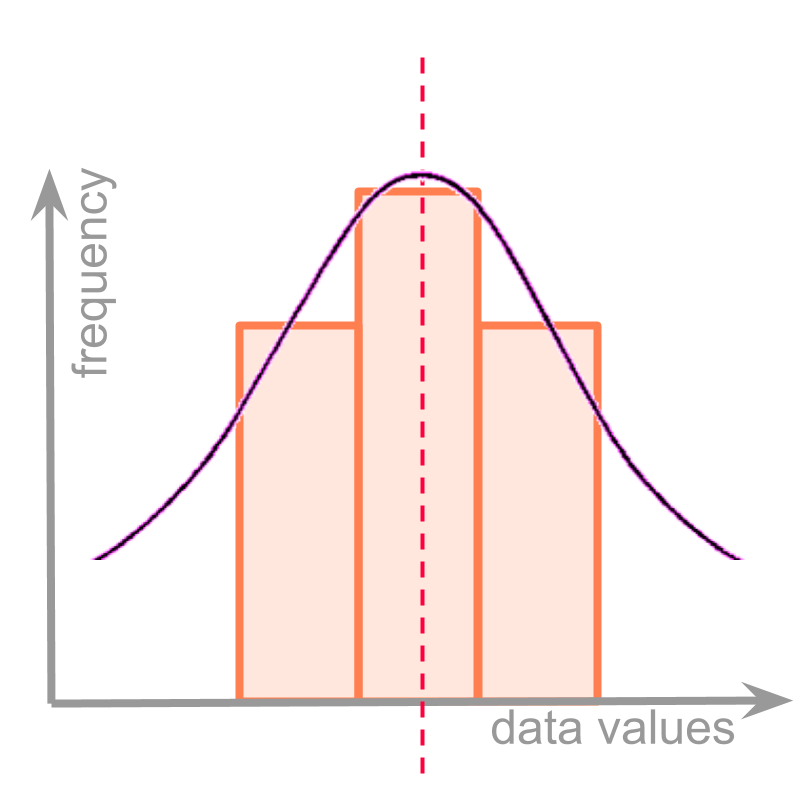
Consider the class partition and the underlying continuous frequency distribution given in the figure.
For simplicity, only three classes of the histogram is shown. In the given examples, by chance, the class lower and upper limits are chosen, such that the modal class is at the exact center of the curve.
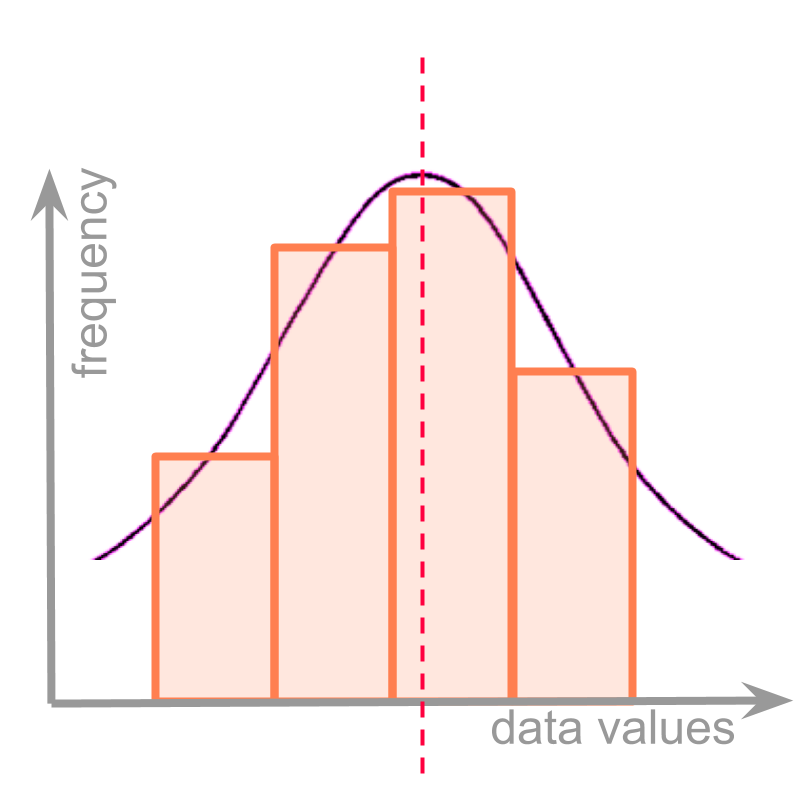
Consider another class partition and the underlying continuous frequency distribution given in the figure.
In this, the class partitions happens to be not at the center of the underlying curve. The objective of defining a formula for mode is to compute the approximate position of the maximum in the underlying curve, which is the frequency distribution.
It is noted that the maximum is within the modal class.
It is also noted that the position of the maximum affects the frequency of the classes on either side of the modal class.
If the position of the maximum is towards the left, then the class on the left has higher frequency than the class on the right. (This is shown in the figure.)
If the position of the maximum is towards the right, then the class on the right has higher frequency than the class on the left.
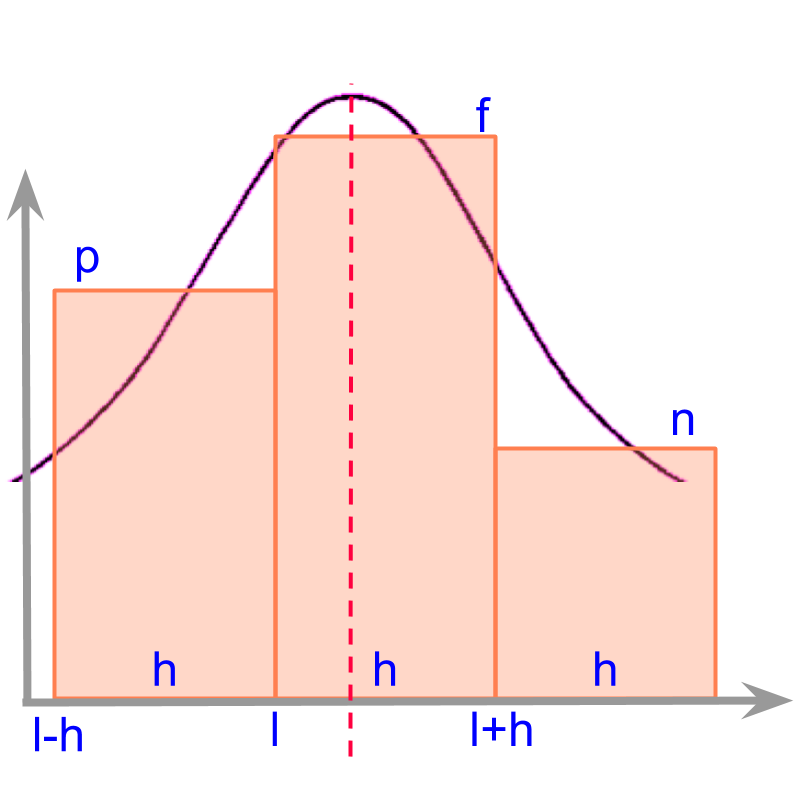
Consider a simple grouped data given in the figure.
This has three class intervals given as
first class is from to
second class is from to
third class is from to
The underlying continuous distribution is visualized and shown in the figure.
The position of maximum on the curve is the mode. The position of maximum is to be computed based on the three classes.
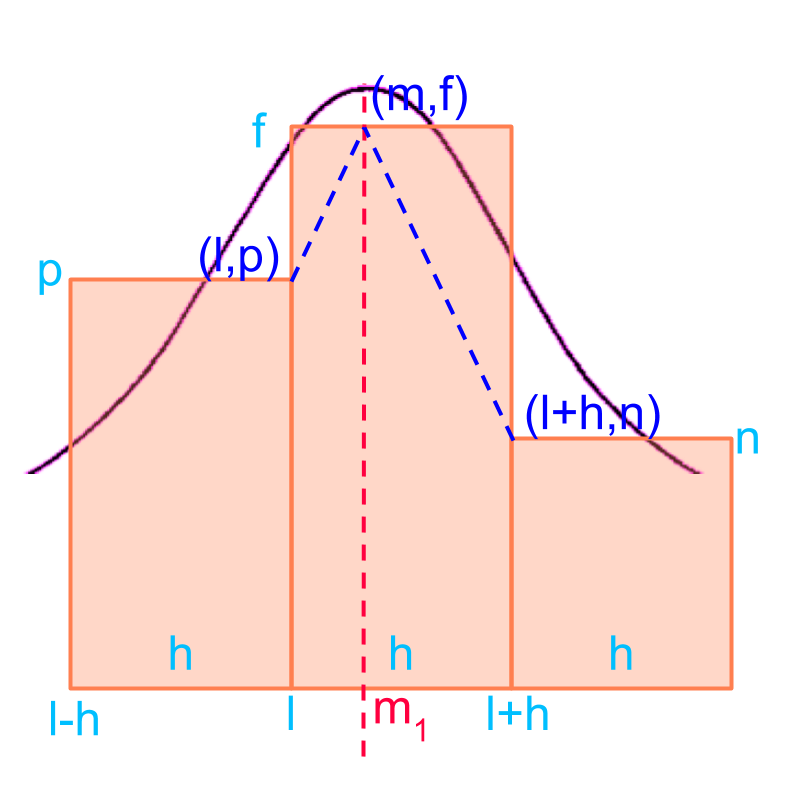
Consider the grouped data given in the figure. The objective is to find position of maximum as the mode of the grouped data.
We can use straight lines to approximate the rate at which data changes near the maximum. The following approximations are used to derive the mode
the rate of changes (or the slope of the lines) on the two sides of the maximum frequency (peak point) are equal. That is the slopes are equal.
the points and are on either side of the maximum.
To work out the approximation, a peak position is assumed.
The in point denotes the mode of the grouped data.
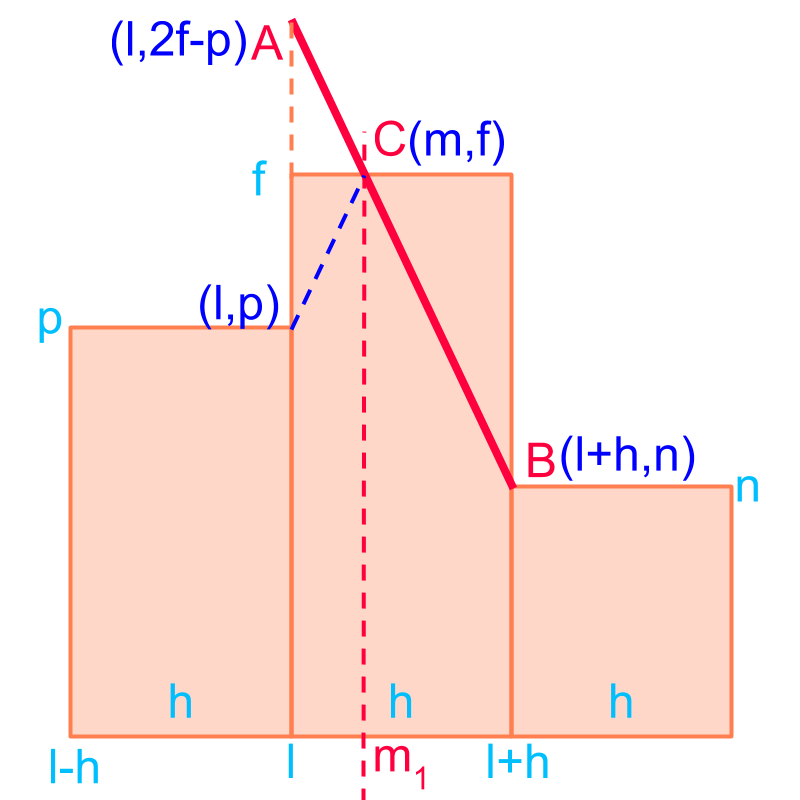
Consider the grouped data given in the figure. The objective is to find the position of maximum as the mode of the grouped data.
The slope of the two line segments are equal.
The line segment is considered and the slope of that equals the slope of the line segments on either side of the maximum
Slope is worked out with line
change in axis
Change in axis
Slope
is the mode of the data.
To find the , equate the slope computed to the slope of the line segment connecting , and .
Solving for
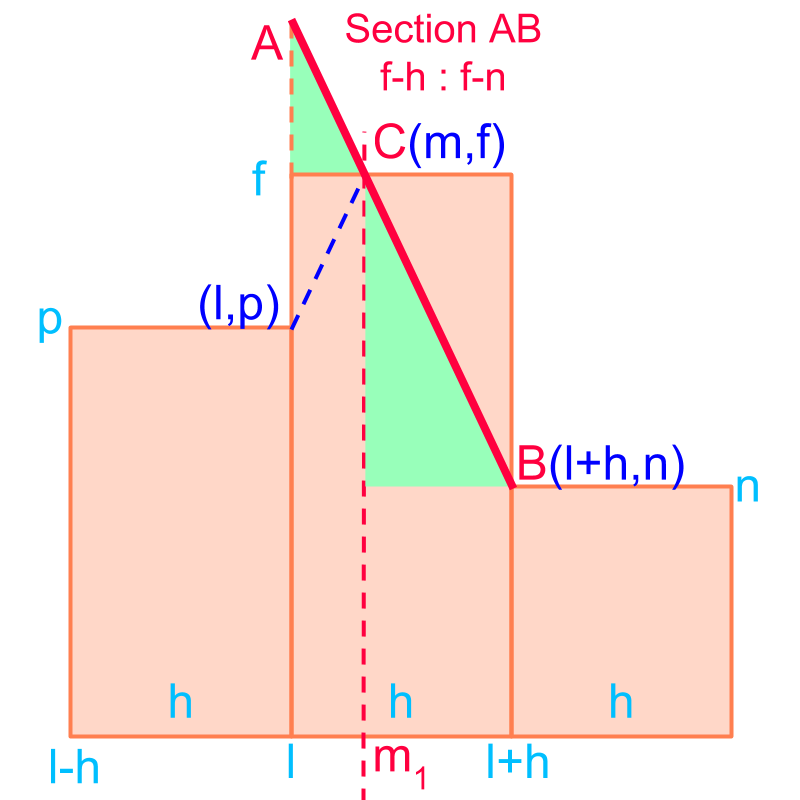
Consider the grouped data given in the figure. The objective is to find the position of maximum as the mode of the grouped data.
Using properties of similar triangles, the problem is modified to sectioning line in the ratio ratio. This is illustrated in the figure.
Considering only the x-axis, the section formula is given as
It is easier to remember the formula for mode -- the mode is the section formula of the x-axis in the ratio of the difference to the frequency on the left to the difference to the frequency on the right.
examples
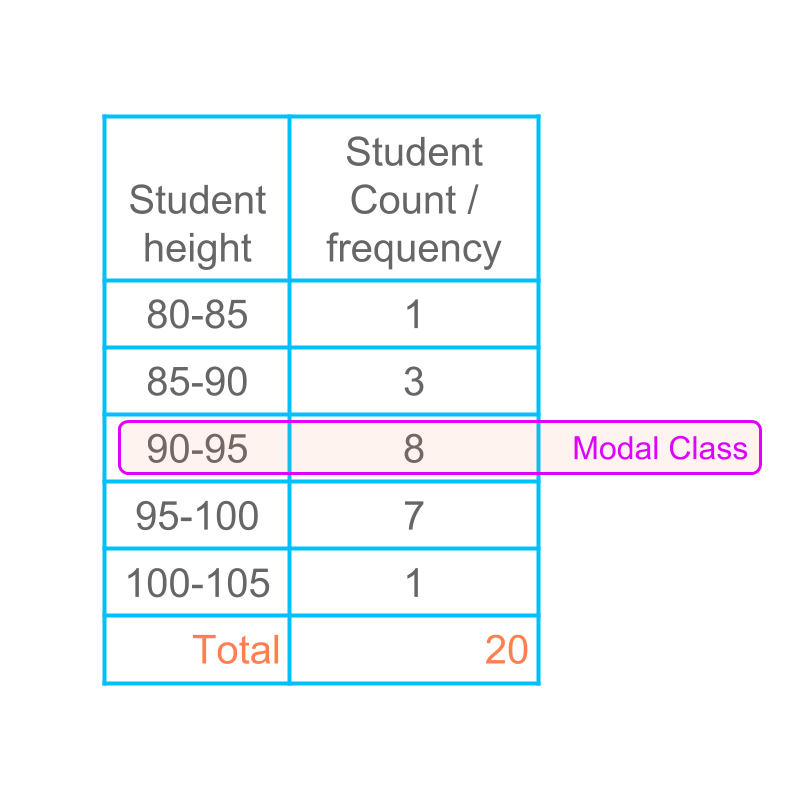
Consider the given grouped data in the table.
The mode is given as
Mode
Consider the given grouped data in the table.
The mode is given as
Mode
summary
Modal Class: The class that has the highest frequency is the modal class.
Mode of Grouped Data : mode of the grouped data is
where
is lower limit of modal class
is the frequency of the modal class
is the frequency of the class previous in order to the modal class
is the frequency of the class next in order to the modal class
is the class-interval
It is easy to remember the formula : The formula is the sectioning of the x-axis of the modal class in the ratio of difference in frequency.
Outline
The outline of material to learn "basics of statistics and probability" is as follows.
Note: Click here for detailed outline of "Basics of Statistics and Probability"
• Introduction
→ Introduction to Statistics
→ Organizing Data : Tally Table
→ Pictograph
→ Bargraph
• Data Analysis
→ Cumulative Frequency
→ Representative Values of Data
→ Central Tendencies
→ Bargraphs & Piecharts
• Probability Fundamentals
→ Predicting Future
→ Random Experiment
→ Probability
→ Standard Experiments
• Statistics Grouped Data
→ Grouped Data
→ Probability in Grouped Data
→ Class Parameters of Grouped Data
→ Methods to find Mean of Grouped data
→ Mode of Grouped data
→ Median of Grouped Data