
what you'll learn...
overview
In this page, the following are introduced and explained
• random experiment
• possible outcomes
• sample space
• sample point
• event
• probability of an event
random means not certain
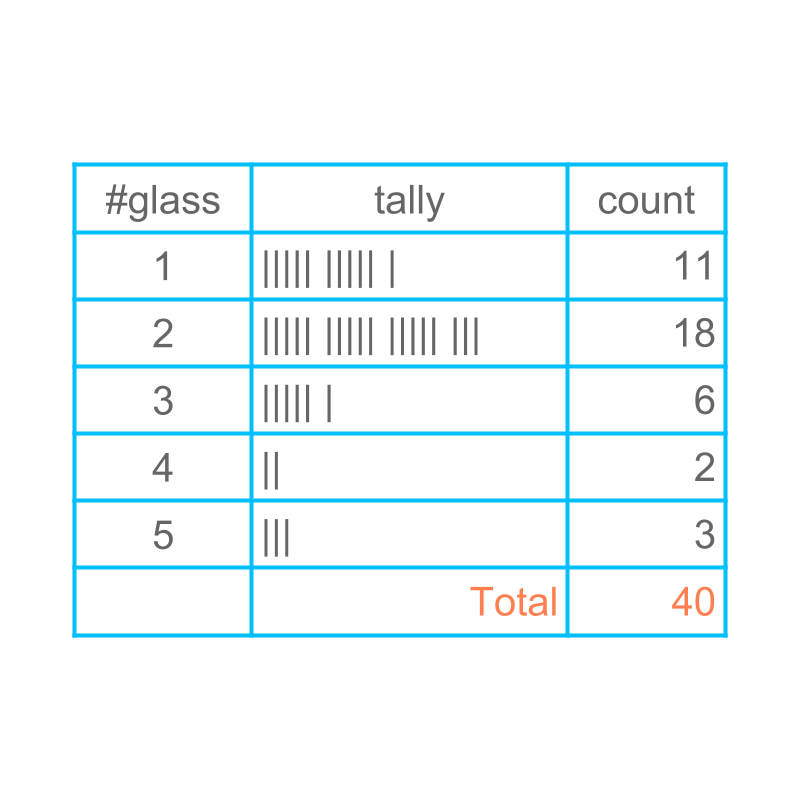
Consider the number of glasses of water students drink during normal day, collected for students. Using the data, we try to predict the data for student.
Considering one student to record the data is the "experiment".
In doing the experiment, one chooses the student without any knowledge about the student. Such experiment is "random experiment".
If we choose a student to record data, knowing already that he took glasses water, It is not a random experiment.
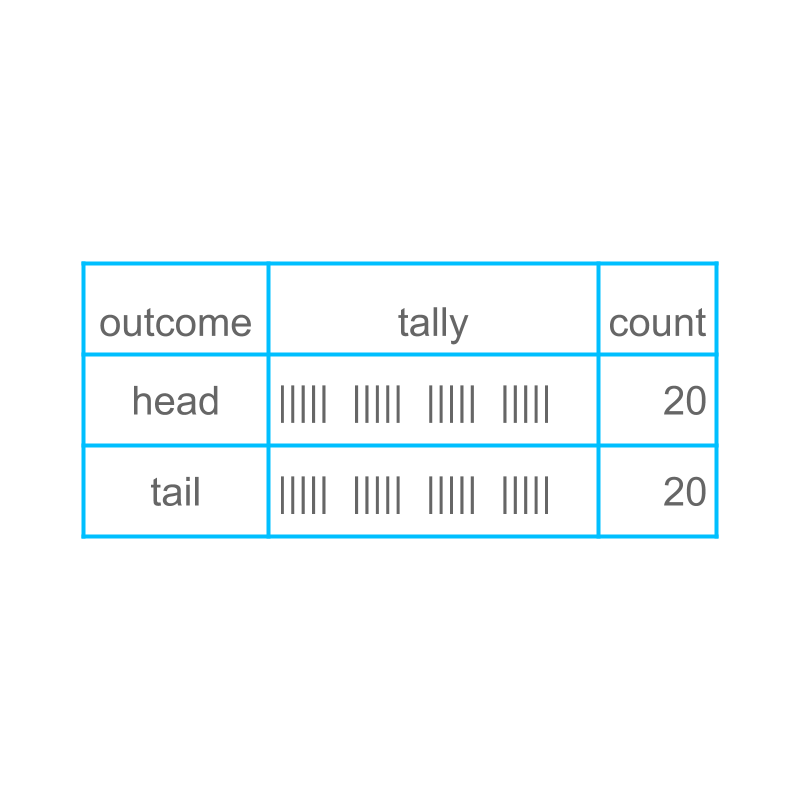
Consider tossing a coin, and recording the data for tosses. Using the data, we try to predict the result of toss.
Tossing the coin once is an "experiment".
In doing the experiment, one chooses the coin that does not favour either side. Such experiment is "random experiment".
We tossed the coin once and found the result as 'tails'. Then again, toss the coin. The first toss does not affect the outcome of the second toss, so the second toss is a random experiment.
The word "random" means: unknown; not defined; chance for many possibilities.
summary
Random Experiment : A process or occurrence for which the result cannot be predicted with certainty.
outcome
Consider the number of glasses of water students drink during normal day, data collected for students. Using the data, we try to predict the data for student.
The number-of-glasses a student drinks is the "outcome" of the experiment.
For example, in one instance of the random experiment, one student drinks glasses of water. The outcome for this instance is glasses of water.
Consider tossing a coin, and recording the data for tosses. Using the data, we try to predict the data for toss.
The face of the coin (heads or tails) pointing up after the toss is the "outcome".
For example, when a coin is tossed, the face of the coin is heads. Tossing a coin is a random experiment, and the outcome of this trial is "heads".
The word "outcome" means result ; something produced or created.
summary
Outcome : A result of an random experiment is an outcome.
all possible outcome
Consider the number of glasses of water students drink during normal day, data collected for students. Using the data, we try to predict the data for student. All possible outcomes are "the sample space".
For example, the sample space of this experiment is , , , , or glasses.
Note: The outcome may include , , or glasses. In such case, the sample space includes , , , , , , , and glasses. But in the given particular case, the sample space is smaller.
Consider tossing a coin, and recording the data for tosses. Using the data, we try to predict the data for toss.
All possible outcomes are "the sample space".
The sample space for the given example is 'heads' and 'tails'.
The phrase "sample-space" means: extent/stretch of the possibilities.
summary
Sample Space : The set of all possible outcomes, when the experiment is repeated many times over, is the sample space.
one outcome
Consider the number of glasses of water students drink during normal day, data collected for students. Using the data, we try to predict the data for student.
One outcome in the sample-space is a "sample point".
For example, glasses of water is a sample point.
Consider tossing a coin, and recording the data for tosses. Using the data, we try to predict the data for toss.
When collecting data, we consider if the outcome is 'heads' or 'tails'. One outcome in the sample space is a "sample point".
For this example, "heads" is a sample point.
summary
Sample Point : One outcome in the sample-space is a sample point.
Outcome and sample point are interchangeably used. Outcome is used in the context of experiment and sample-point is used in the context of sample space.
the desired outcome
Consider the number of glasses of water students drink during normal day, data collected for students. Using the data, we try to predict the data for student.
One experiment is to find possibility of or more glasses of water for one student. In that case, the outcomes are , , and . The set of desired outcome together is called an "event".
In an experiment, the desired outcome is glasses of water. In this case, glasses of water is the event.
Consider tossing a coin, and recording the data for tosses. Using the data, we try to predict the data for toss.
One experiment is to find possibility of 'tails'. The outcome "tails" is the event for the specified experiment.
The word "event" means: something that happens or takes place.
summary
Event : A desired outcome or a combination of multiple desired outcomes is an event.
how much likely
Consider the number of glasses of water students drink during normal day, data collected for students. Using the data, we try to predict the data for student.
One experiment is to find possibility of glasses of water for one student. The prediction is times out of times. The prediction about an event based on data is the "probability" of the event.
The probability of glass is understood as times out of every times and is given as .
Consider tossing a coin, and recording the data for tosses. Using the data, we try to predict the data for toss.
One experiment is to find the possibility of 'tails' for one toss. The prediction is times out of times. The prediction about an event base on data is the "probability" of the event.
The probability of 'heads' is understood as times out of every times and is given as .
Note: The fraction representing a probability can be simplified as per the rules of simplification of fractions.
Probability of "heads" in "toss of a coin" is , which is understood as for a large number of tosses, the event "heads" appears out of times.
Probability does not mean for every toss, head appears . On the contrary, it is a possibility that if a coin is tossed times, the event "tails" appears all times.
If the coin is tossed a million times, then very close to half a million time the "heads" is expected to appear.
Repeating, the probability means, in large number of repetitions, the event appears out of times.
The word "probability" means: measure of likelihood of an event.
summary
Probability : The number of times an event is likely to appear per experiment is the probability of the event.
summary
Random Experiment : A process or occurrence for which the result cannot be predicted with certainty.
Outcome : A result of an random experiment is an outcome.
Sample Space : The set of all possible outcomes, when the experiment is repeated many times over, is the sample space.
Sample Point : One outcome in the sample-space is a sample point.
Outcome and sample point are interchangeably used. Outcome is used in the context of experiment and sample-point is used in the context of sample space.
Event : A desired outcome or a combination of multiple desired outcomes is an event.
Probability : The number of times an event is likely to appear per experiment is the probability of the event.
Outline
The outline of material to learn "basics of statistics and probability" is as follows.
Note: Click here for detailed outline of "Basics of Statistics and Probability"
• Introduction
→ Introduction to Statistics
→ Organizing Data : Tally Table
→ Pictograph
→ Bargraph
• Data Analysis
→ Cumulative Frequency
→ Representative Values of Data
→ Central Tendencies
→ Bargraphs & Piecharts
• Probability Fundamentals
→ Predicting Future
→ Random Experiment
→ Probability
→ Standard Experiments
• Statistics Grouped Data
→ Grouped Data
→ Probability in Grouped Data
→ Class Parameters of Grouped Data
→ Methods to find Mean of Grouped data
→ Mode of Grouped data
→ Median of Grouped Data