
what you'll learn...
Overview
Integration : Graphical Meaning
» Graphical Meaning of integral: area under the curve
 → ∫f(x)dx∫f(x)dx=c+∫x0f(x)dx=c+∫x0f(x)dx
→ area under a curve from y axis to x=ax=a is ∫x0f(x)dx∣x=a∫x0f(x)dx∣∣∣x=a
 → area above the xx-axis (shown in green) is positive
→ area below the xx-axis (shown in purple) is negative
→ area traversed in positive xx direction (shown in green) is positive
→ area traversed in negative x direction (shown in red) is negative
 → The constant of integration c is the intial value of the quantity
→ ∫f(x)dx represents set of curves given by ∫x0f(x)dx+c. This set is for various c .
set-up
For now, integration of f(x) is considered in general to be
∫f(x)dx=c+∫x0f(x)dx
constant c is the initial value of integral at x=0.
The classification as definite integral and indefinite integral or anti-derivatives will be explained in due course.
Summary of integration: Given y=f(x) a function of variable x, the integral of y is
∫f(x)dx=c+limn→∞n∑i=1f(ixn)×xn
That is, the integral is another function of variable x
the definite integral will be explained later.
y=x
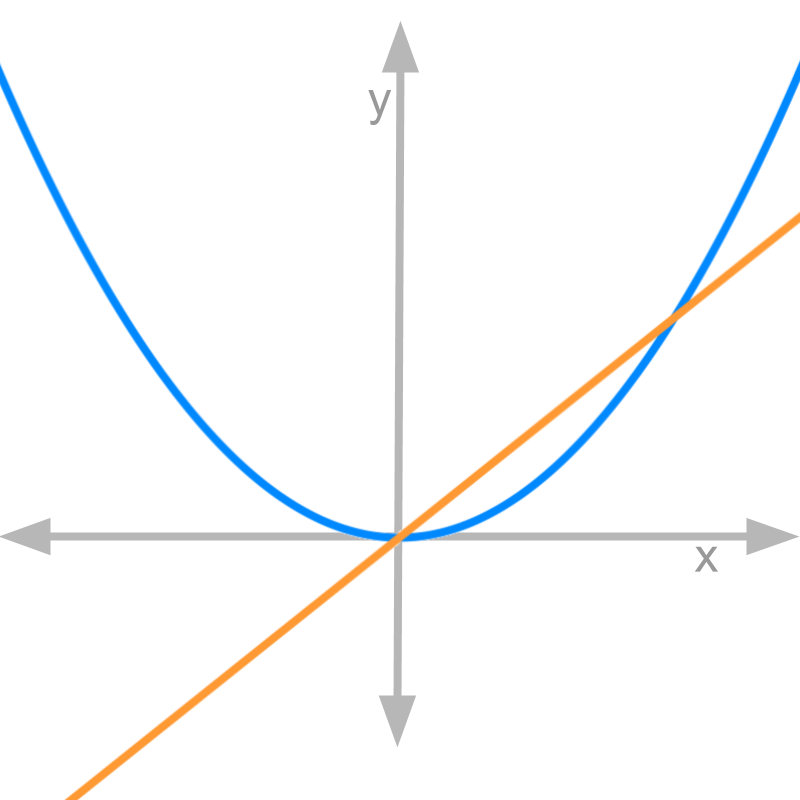
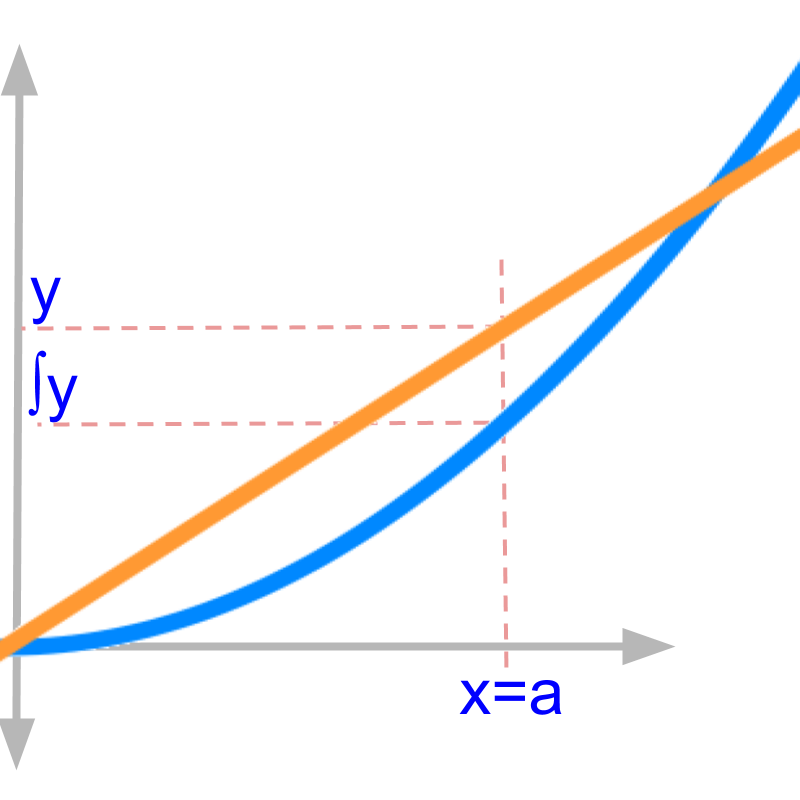
Let us consider y=x and the integral ∫xdx=x22+c.
The figure depicts both the functions. Orange color line is the given function y=x and the blue color curve is the integral ∫xdx=x22+0.
the continuous aggregate is given as a function of x.
That is, the continuous aggregate of orange line is plotted as blue curve.
note: The plot is not to the scale on x and y axes.
zoom-in
The figure zooms in a small part of the plots. The two values at x=a (on the orange line and blue curve) signify
• y is the value function evaluates to at x=a
• ∫ydx is the continuous aggregate of y between x=0 and x=a
This result is known from the algebraic derivations. Let us see what this means in the given graphs.
making sense
The integral in first principles is given as
∫ydx
=limn→∞n∑i=1ixn×xn
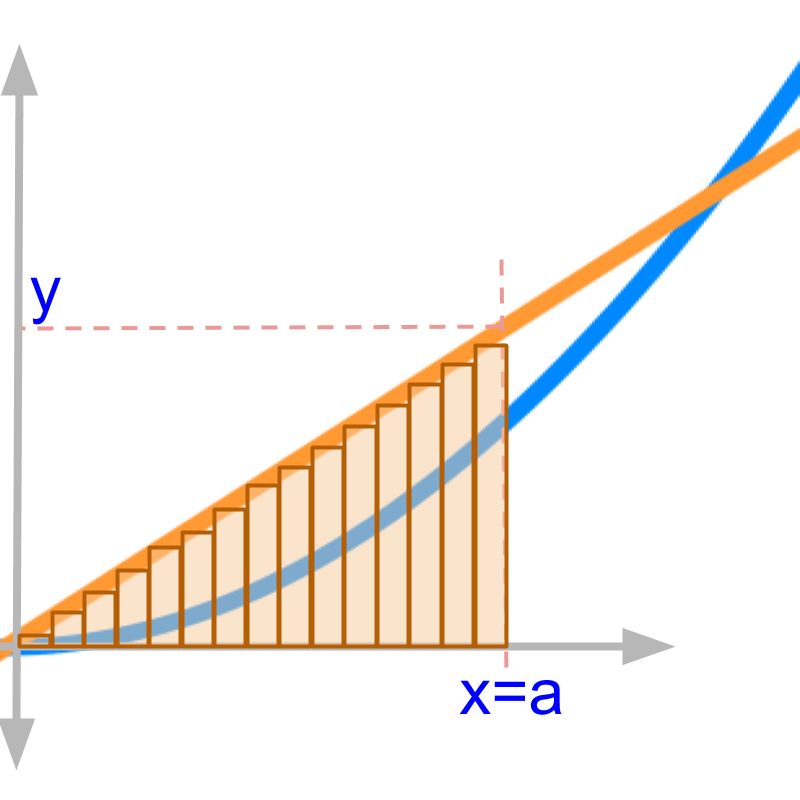
The expression inside the summation xn means -- the interval between 0 and x is split into n partitions. These n partitions are shown as n vertical bars placed on x axis.
keeping aside the limit limn→∞, and considering the sum with an assumed value for n
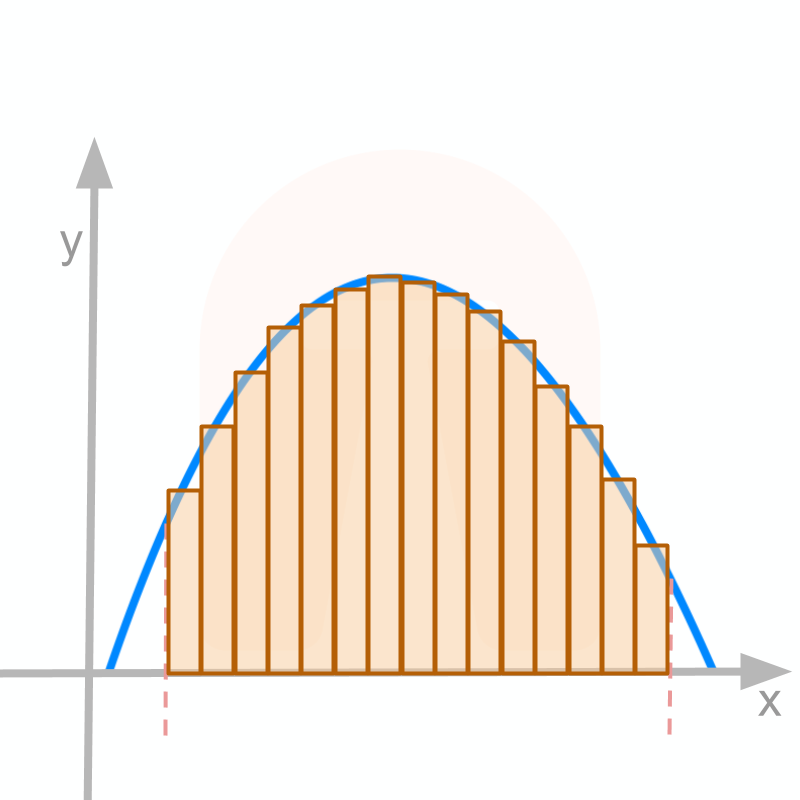
The expression inside the summation f(ixn)×xn means -- the value of function at each of the n partitions is multiplied by the partition width. The value is shown by the height of the vertical bars of the n partitions on the x axis and these bars reach the line represented by the given function.
The sum is illustrated in the figure as vertical bars. The n is chosen to be 15.
Set aside the limit limn→∞, and consider the sum with n=15
Geometrically, the integral given by the sum depicts the area under the given function y=x between 0 and a
x squared
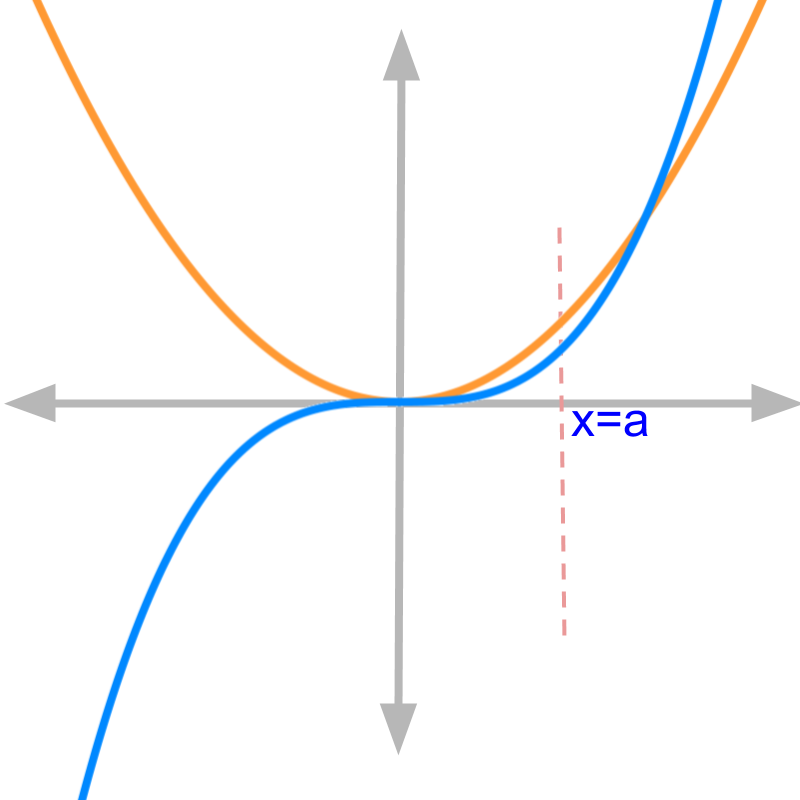
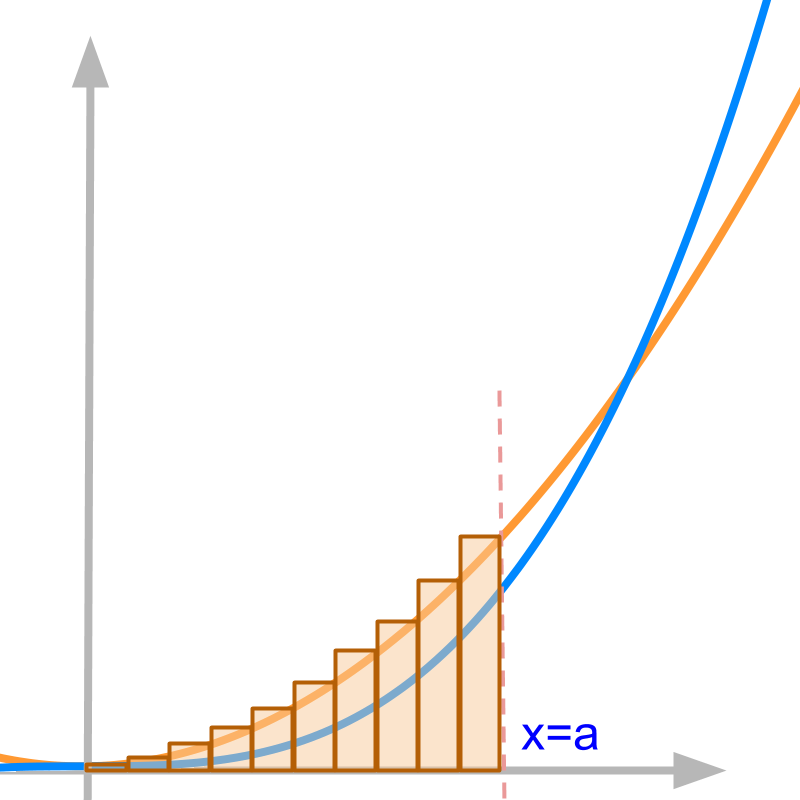
Consider a different function y=x2 and the integral of the function ∫x2dx=x33+c.
The orange color curve is the given function y=x2 and the blue color curve is the integral x33
assuming the constant of integration c=0
The continuous aggregate of orange line is plotted as blue curve.
Note that the continuous aggregate is a function of x.
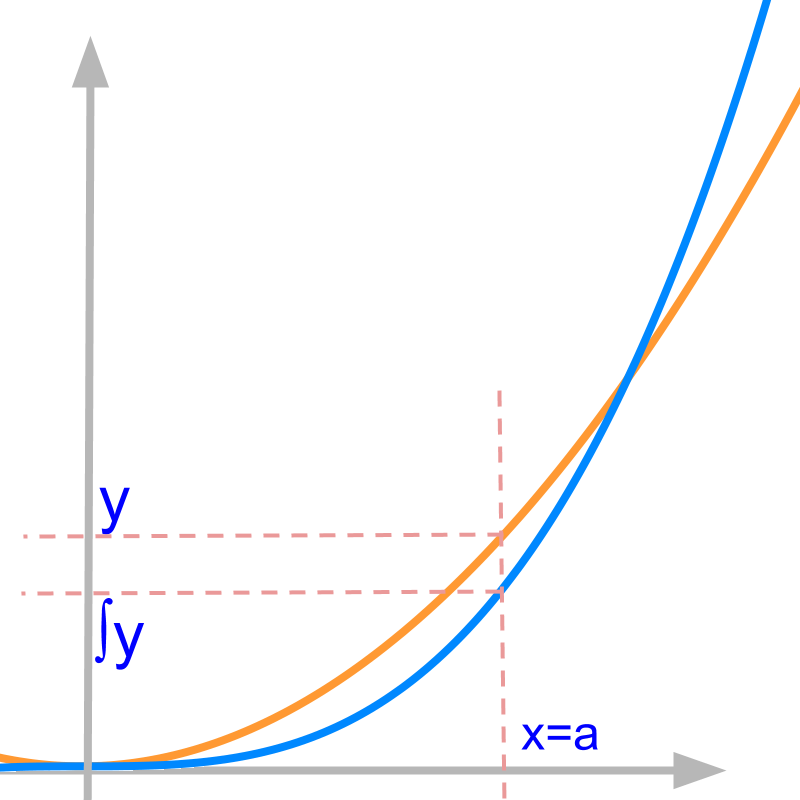
The figure zooms in a small part of the plots. y is the value function evaluates to at x=a ∫y is the continuous aggregate of y between x=0 and x=a This result is known from the algebraic derivations. Let us see what this means in the given curve.
The integral in first principles is given as
∫ydx
=limn→∞n∑i=1(ixn)2×xn
The sum is illustrated in the figure as vertical bars. The n is chosen to be 10.
Setting aside the limit limn→∞, and considering the sum with n=10
Geometrically, the vertical bars given by the sum depicts area under curve.
Are the following two equal?
the area under curve y=x2 and the sum given by the vertical bars.
No, the two are not equal.
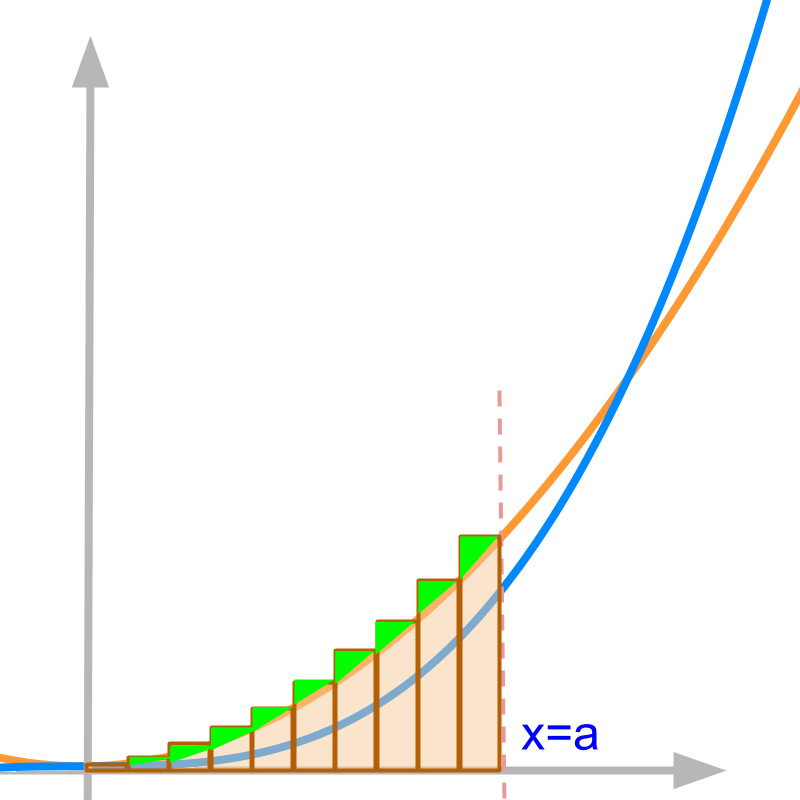
The difference between area under the curve and the sum of vertical bars with n=10 is highlighted in green.
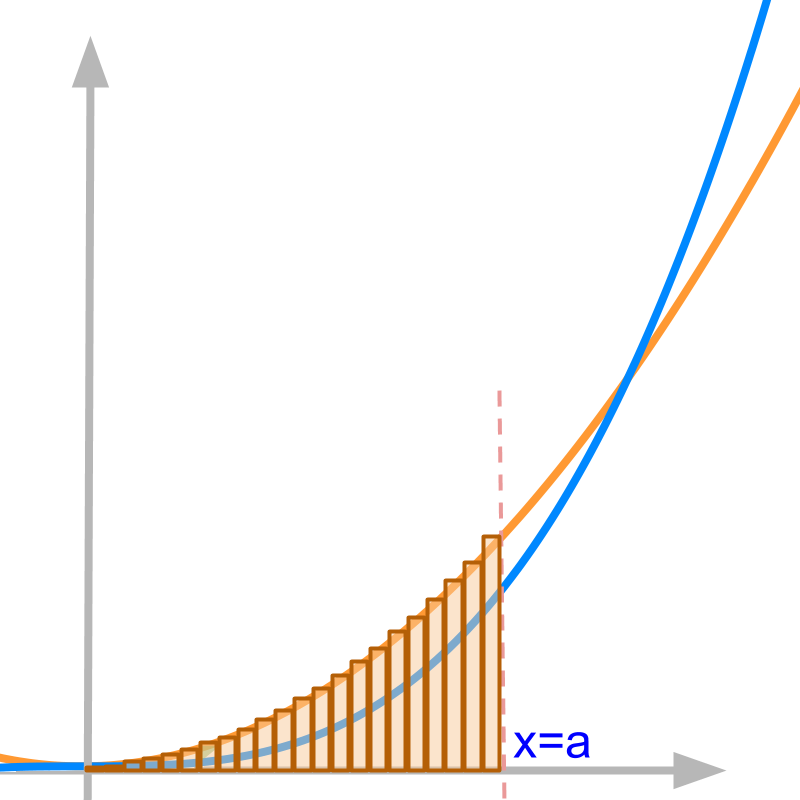
Set aside the limit limn→∞, and consider the sum with n=20
The difference between area under the curve and the sum with n=20 is lesser than the same difference with n=10.
Considering y=x2 and ∫ydx=x33+c given in the figure.
The integral in first principles is given as
∫ydx
=limn→∞n∑i=1(ixn)2×xn
As the limit n tending to infinity is applied, the area under the curve and the sum given by vertical bars are identical.
Note that the function is assumed to be continuous and integrable. These will be explained later in detail.
summary
∫x0ydx∣x=a is the area under the curve between x=0 axis and x=a.
Note 1: The definition of the integral is taken to be ∫x0f(x)dx
Note 2: The constant of integration (c) is not explained yet.
Note 3: In this definition, the area under the curve is signed area, that is it can have both positive and negative values.
These "notes" are explained later with examples.
initial value to add to
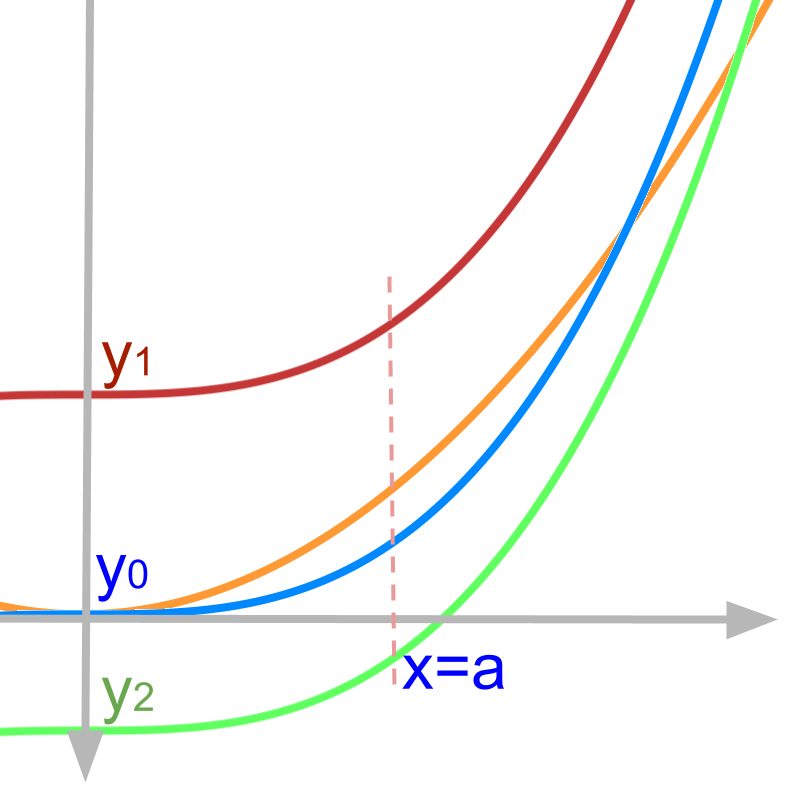
Considering y=x2 in orange.
By definition, ∫ydx=c+∫x0ydx
The integral is the continuous aggregate added to the initial value c. That is, the quantity (which is the result of summation carried out in integration) might have a non-zero initial value.
• The curve in blue shows the ∫x2dx with an initial value y0=0.
• The curve in red shows the ∫x2dx with an initial value y1 : a positive value.
• The initial value of the curve in green is a "negative value".
making sense of the initial value
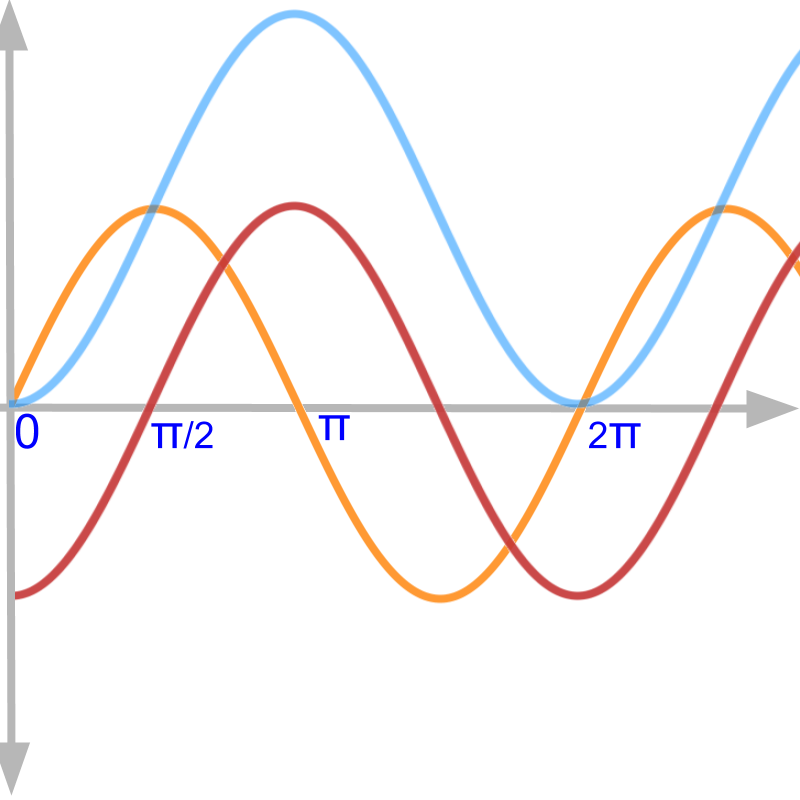
We had understood the initial value as constant in abstraction. That has some physical significance in applications. To explore this, the function y=sinx and integral ∫sinxdx=-cosx+c is considered.
The result of integration will be proven later.
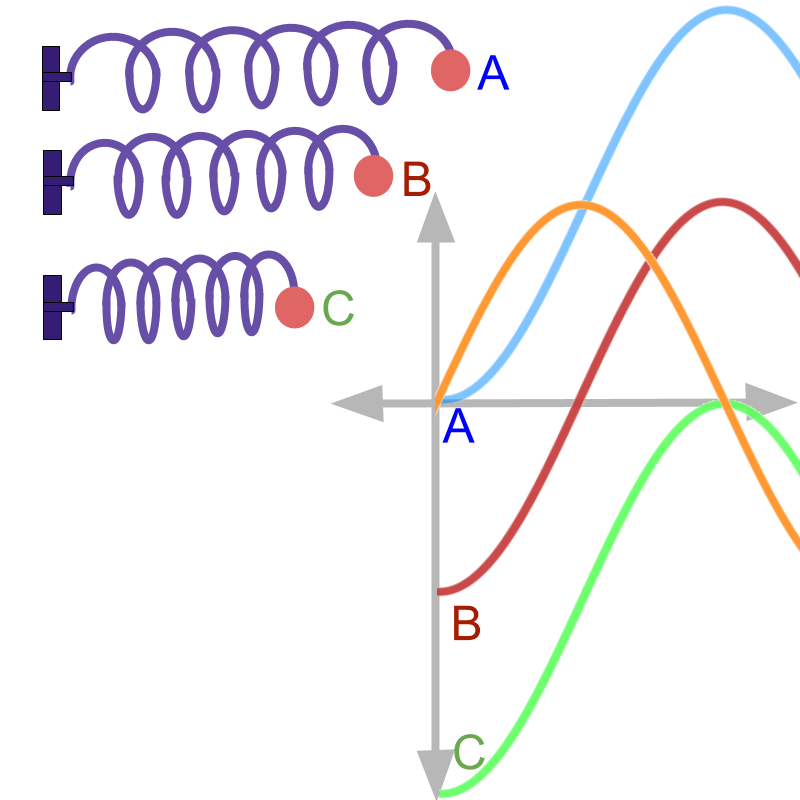
Given y=sinx and integral of y, the application scenario is the velocity and displacement of a ball attached to an oscillating spring.
The position of rest is shown as position B.
The velocity v=sint is plotted in orange.
The spring is pulled from position of rest B to an initial position A and released.
The displacement is measured from right to left. And it can be measured from one of the following start positions.
• from position A, in which case, the constant is 1.
• from position B, in which case, the constant is 0.
• from position C, in which case, the constant is -1.
The initial value is calculated by equating the derived value to the observed value. From position A:
• the derived value is -cost+c when time t=0
• Observed value is 0 when time t-0
Equating these two -cos0+c=0 results in c=1.
Students may work out the same for position B and position C. The values of constants for position B and Position C are "0 and -1".
negative area
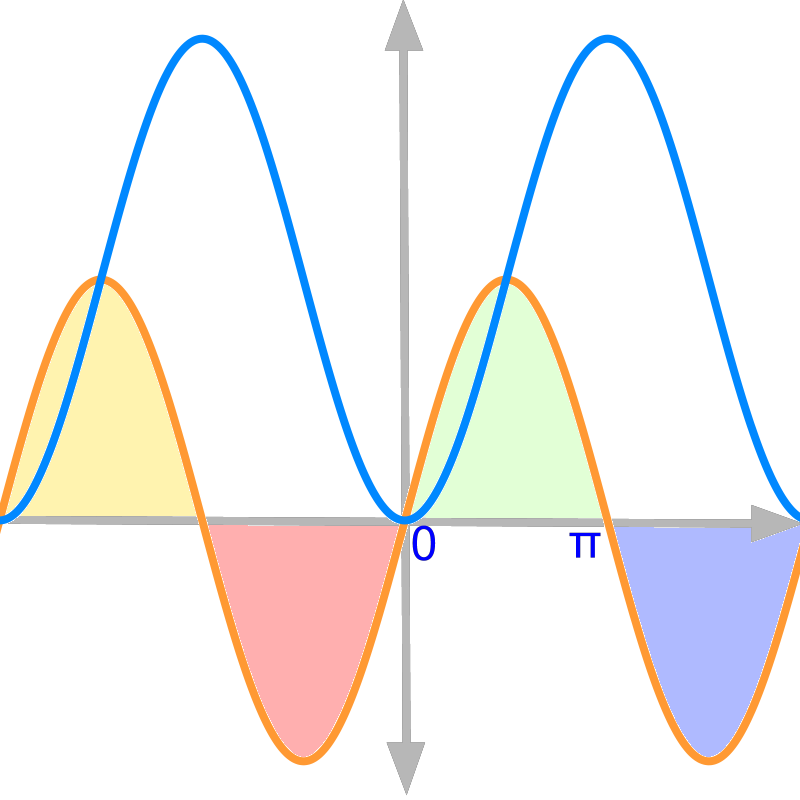
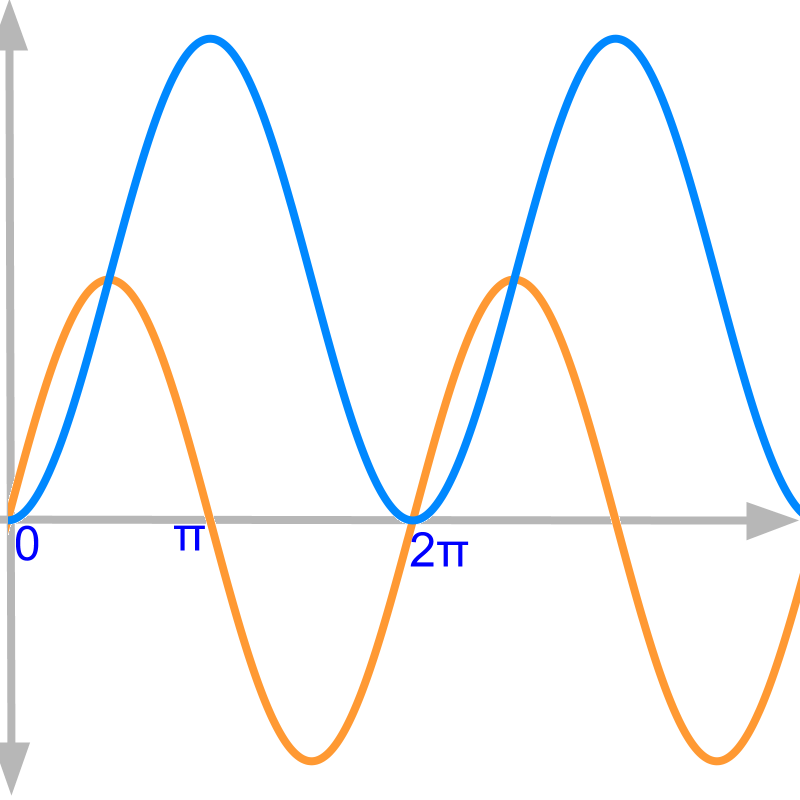
Consider y shown as orange curve and the ∫ydx shown as blue curve.
The curves are sinx and its integral. This will be explained in standard results of integrals.
Between x=0 and x=π, the function y has positive value. The area under the orange curve is increasing between x=0 and x=π. Observe the blue curve that depicts the area as a function of x.
The value of integral (shown in blue) between x=0 and x=π is "increasing"
Between x=0 and x=π, the function y has positive value and the value of integral is increasing.
Between x=π and x=2π, the function y has negative value. The area under the curve is negative between x=π and x=2π. The negative area is added to the integral value at x=π.
The value of integral between x=π and x=2π is "decreasing"
Consider y=x shown as orange curve and the ∫ydx=x22+c shown as blue curve. For this example, c=0.
On the negative x-axis, the area under the curve is negative. But, the integral value (given by blue curve) is positive. The integration is defined from x=0 and area is negative when the range is traversed in the negative direction.
∫f(x)dx=∫x0f(x)dx+c
In negative x axis, the value of upper limit x is negative. The summation is in the reverse direction from 0 to negative value of x.
Integral summation is defined for integration starting from y-axis, traversing to the right or positive direction. But, in the negative x axis, integration traverses to the left, which is the negative direction.
Negative area multiplied negative traversal makes the value of integration positive.
Consider y=x2 shown as orange curve and the ∫ydx=x33+c shown as blue curve. For this example, c=0.
On the negative x-axis, the area under the curve is positive. But, the integral values (given by blue curve) is negative. The integration is defined from x=0 and that makes the positive area multiplied by negative.
∫f(x)dx=∫x0f(x)dx+c
In negative x axis, the summation is in the reverse direction from 0 to negative value of x.
Integral summation is defined for integration starting from y-axis, traversing to the right. But, in the negative x axis, integration traverses to the left, which is negative.
Positive area multiplied negative traversal makes the value of integration negative.
making sense of negative area
We have understood the positive and negative areas under the curve in abstraction. Does that have any physical significance in applications? To explore this, the function y=sinx and integral ∫sinxdx=-cosx+c is considered.
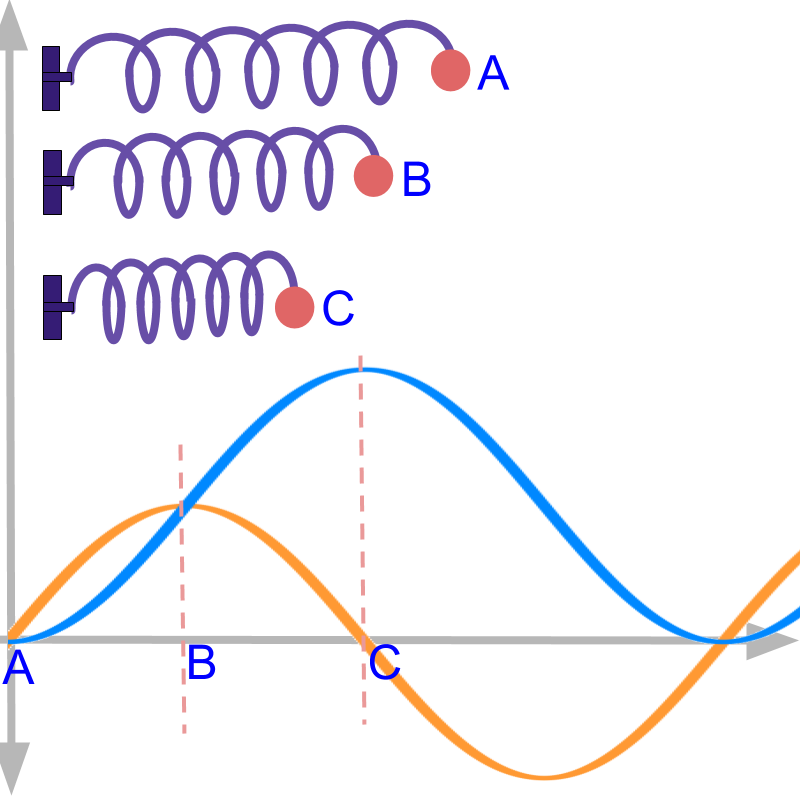
Given y=sinx and integral of y, the application scenario is the velocity and displacement of a ball attached to an oscillating spring.
The position of rest is shown as position B.
The velocity v=sint is plotted in orange.
The displacement s=∫vdt=-cosx+1 is plotted in blue.
• The spring is pulled from position of rest B to an initial position A and released.
In this position A, the velocity is "0". The ball is released and so its initial velocity is 0.
• At the initial position A, the velocity is 0.
• The displacement is measured from that initial position A and thus is 0.
• As the pulled spring is released, it gains velocity. As it reaches the position of rest B, it has gained maximum velocity. That is shown as the point B and orange curve reaches maxima.
• At the position of rest B, the displacement (integral of the velocity) is a positive value.
In an oscillating spring, at the position of rest, the velocity is maxima and minima.
The ball has reached from position A to Position B with velocity reaching maxima.
• Because of inertia, the ball continues in the same direction, but the spring exerts force in opposite direction, as the spring is being compressed beyond position B. Thus, the velocity reduces.
• The displacement continues to increase.
• As the reducing velocity reaches 0, the spring reaches the maximum displacement. This is shown as the point C and blue curve reaches maxima.
In an oscillating spring, at the position C, the velocity is 0.
The ball was released from position A, has crossed position B, and has reached position C.
• The spring is compressed at position C and it exerts force on the ball. This results in velocity increasing in negative direction.
• The displacement reduces from the position C.
This explains, what is meant by "negative- area" under the curve.
The displacement "decreases" after reaching the position C. This is shown by the blue curve decreasing beyond. In this interval, the velocity is in the negative direction and is shown by the orange curve.
summary
Graphical meaning of Integrals:
• definite integral represents the signed area under the curve.
• indefinite integral can be interpreted as the signed area under the curve from 0 to x added to initial constant c
• Area is positive if it is above the x axis and negative if it is below the x axis.
• Traversal is positive if it is in positive x direction and negative if it is in negative x direction.
• The sign of the integral is the product of the sign of area and sign of the traversal.
• The constant of integration is the initial value of the quantity represented by the integral.
mischievous question
Given y=x2, What is the length of the curve from x=0 as a function of x?
The significance of this question is in "solving for length of the curve". Integration is taught to be area under the curve. Then how can that be used to find length of curve instead?
Don't "rigidly learn" the idea that integration is area under a curve. Better, integration is continuous-aggregate.
When an integration is expressed as ∫f(x)dx, then the integration is area under the curve given by f(x).
If a curve g(x) is given and you are to find the arc length of that, then you'll have to formulate the arc-length for a small increment dx and integrate that. This formulation of continuous-aggregate results in an integration ∫h(x)dx, in which h(x) is a function representing another curve. At this point, one can claim this integration is area under the curve h(x). This area under the curve h(x) is the arc length of the original curve g(x). Yes, that is not a typo -- area of one curve is arc-length of another.
After studying that the graphical meaning of the integration is area under the curve, using integration to find the length of the curve might be confusing. Let us consider an
If y=x2 is integrated, then it is the area under the given curve.
But the question is to find length of curve. Formulate the length of the curve as given below.
• For a small change dx, the change in y is dy.
• For a small change, dx, and dy forms a right-triangle with hypotenuse as arc length
• Small change in Arc length =√dx2+dy2.
Aggregate of arc length is integration of small change in arc length.
Arc length s
=∫x0√dx2+dy2
=∫x0√dx2+(2xdx)2
=∫x0√1+4x2dx
Note: After the formulation for arc length is derived as ∫x0√1+4x2dx, this integration can be considered as area under the curve for the function √1+4x2. And this area is equivalently the arc length for given y=x2. This is little involved to understand, hope you could.
Integrating this expression is given in due course. The point is that instead of defining and remembering integration as area under the curve, remember that integration is continuous aggregate. Area under the curve is one form, that is, when the given function is directly integrated.
summary
Graphical meaning of Integrals:
• definite integral represents the signed area under the curve.
• indefinite integral can be interpreted as the signed area under the curve from 0 to x added to initial constant c
• Area is positive if it is above the x axis and negative if it is below the x axis.
• Traversal is positive if it is in positive x direction and negative if it is in negative x direction.
• The sign of the integral is the product of the sign of area and sign of the traversal.
• The constant of integration is the initial value of the quantity represented by the integral.
Outline
The outline of material to learn "Integral Calculus" is as follows.
• Detailed outline of Integral Calculus
→ Application Scenario
→ Integration First Principles
→ Graphical Meaning of Integration
→ Definition of Integrals
→ Fundamental Theorem of Calculus
→ Algebra of Integrals
→ Antiderivatives: Standard results
→ Integration of Expressions
→ Integration by Substitution
→ Integration using Identities
→ Integration by Parts
→ Integration by Partial Fraction
→ Integration: Combination of Methods