
what you'll learn...
Overview
» Graphical Meaning of Derivative: slope of the tangent
 → at a point , the rate of change of the curve is
→ at a point , the slope of the tangent is .
→ at the maxima of the curve , the derivative crosses from positive rate of change to negative rate of change.
→ at the minima of the curve , the derivative crosses from negative rate of change to positive rate of change.
recap
Summary of differentiation:
Given a function of variable , the derivative of is
.
"The derivative is another function of variable ".
For some functions, the derivatives are numerical values. That is, the derivative is not a numerical value for all functions.
graphical
Let us consider and . The figure depicts both the functions. Blue color curve is and orange color line is .
note: The plot is not to the scale on x and y axes.
The rate of change of blue curve is plotted as orange line.
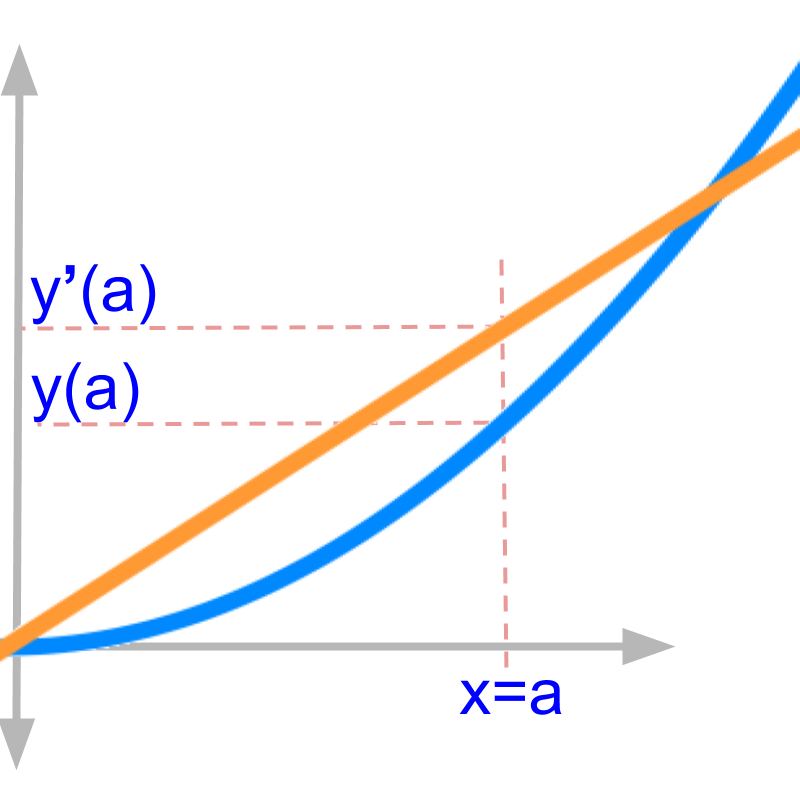
The figure zooms in a small part of the plots.
• is the value function evaluates to at
• is the rate of change of at
This result is known from the algebraic derivations. Let us see what this means in the given curve.
Considering and given in the figure.
The derivative in first principles is given as
at is shown in the figure.
for the is shown in the figure.
the derivative is derived using limit tending to
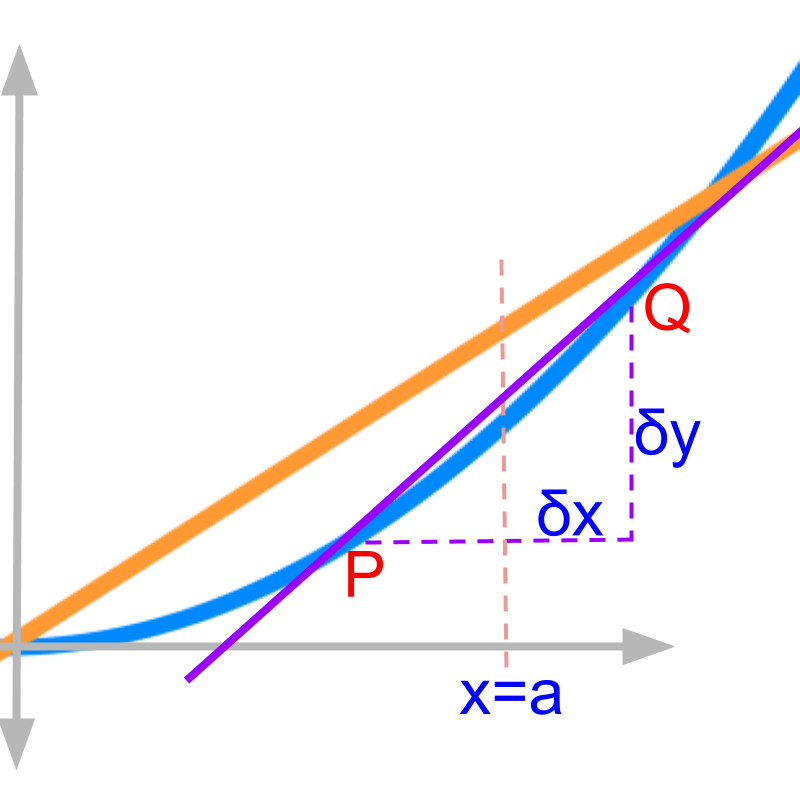
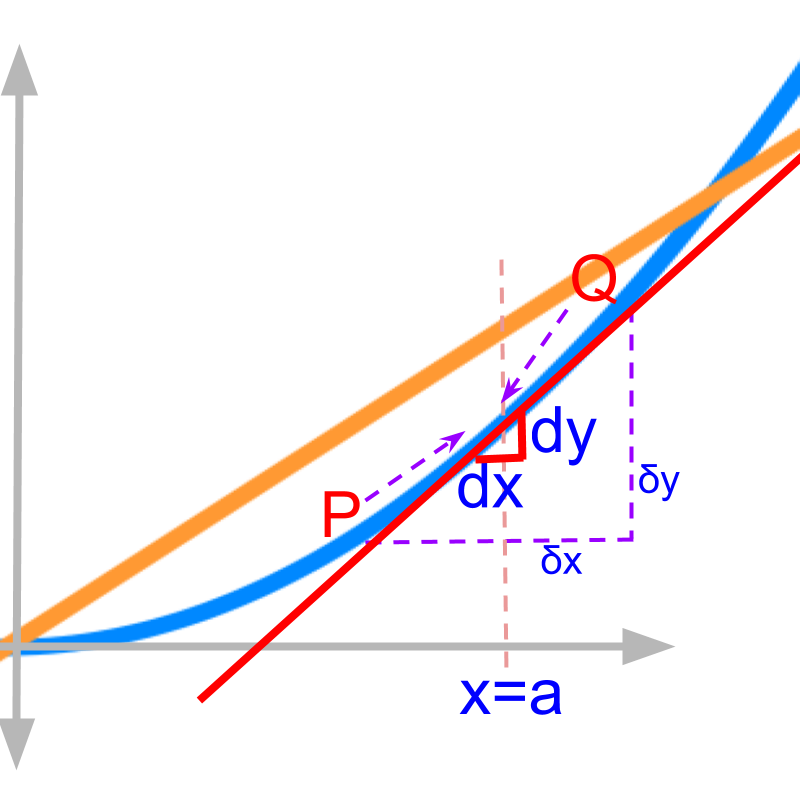
The figure shows non-zero and corresponding before limit is applied.
The points and are on the curve separated by on .
Consider the line passing through the points and . The line is a secant as the line passes through two points on the curve.
It shows non-zero and corresponding before limit is applied. The slope of the line is "". The line passing through the points and
Slope of the secant
Considering and given in the figure.
The derivative in first principles is given as
Applying the limit, the and reduces "close to ", which is shown in red.
The points and at the two ends of moves towards each other. When limit is close to zero, the two points and merge to become a single point. The points and move towards each other and merge.
The line passing through and is shown in red. As the limit is applied, the line touches the curve in only one point
The line is a "tangent", as the line touches at a single point on the curve.
The slope of the tangent at is "". The rate of change is the slope at that point.
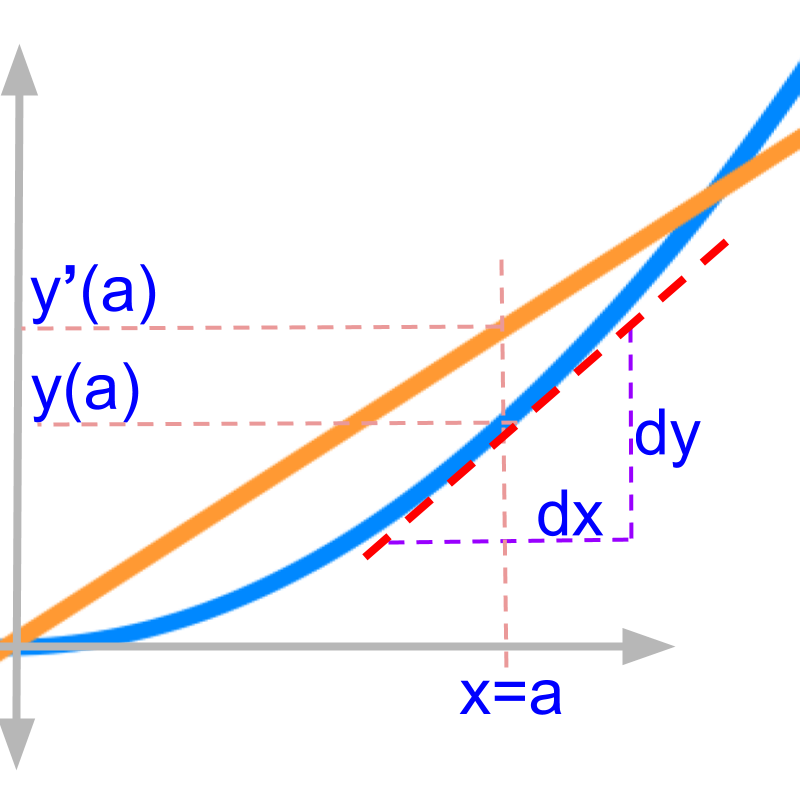
is the slope of the tangent on curve at position . The tangent is shown in red dotted line.
analysing the curves
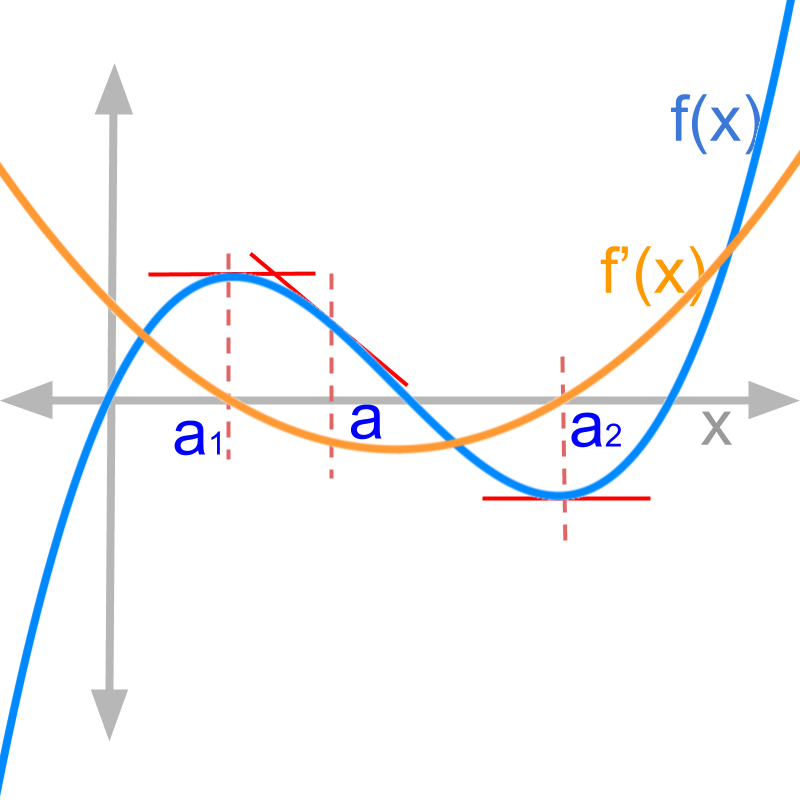
For a function , the slope of tangent at is .The figure shows in blue and in orange. Three positions are identified with vertical lines.
The slope of at the position is negative or decreasing rate of change. This is also evident from the negative value at the same position in orange line.
The slope of at the position is "positive or increasing rate of change". This is also evident from the positive value at the same position in orange line.
The slope of at the position is "zero". This is also evident from the zero value at the same position in orange line.
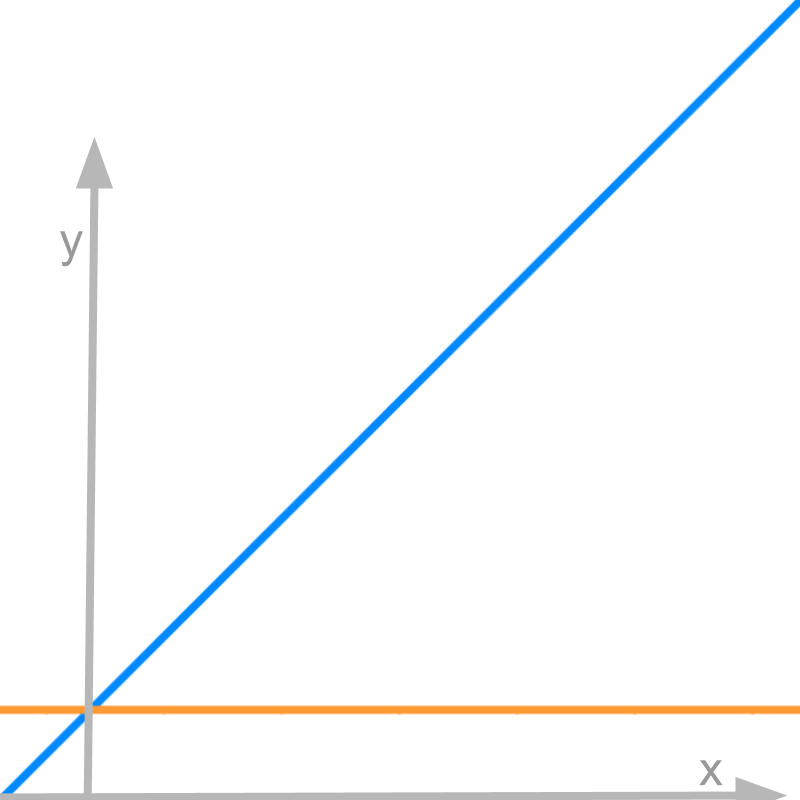
Figure shows in blue and in orange. From the figure, we understand that "the function has constant rate of change". This is evident from the flat orange line.
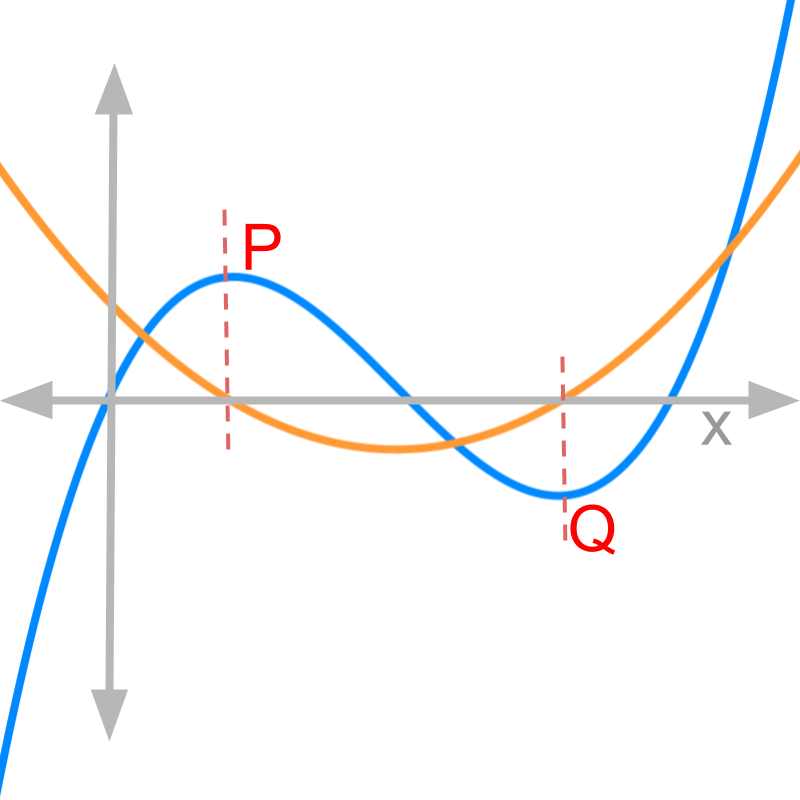
The figure shows in blue and in orange.
• when reaches maximum, the rate of change is
• when reaches minimum, the rate of change is
This is evident from the values on orange line, the derivative of the function, having value 0 at the positions of maxima and minima.
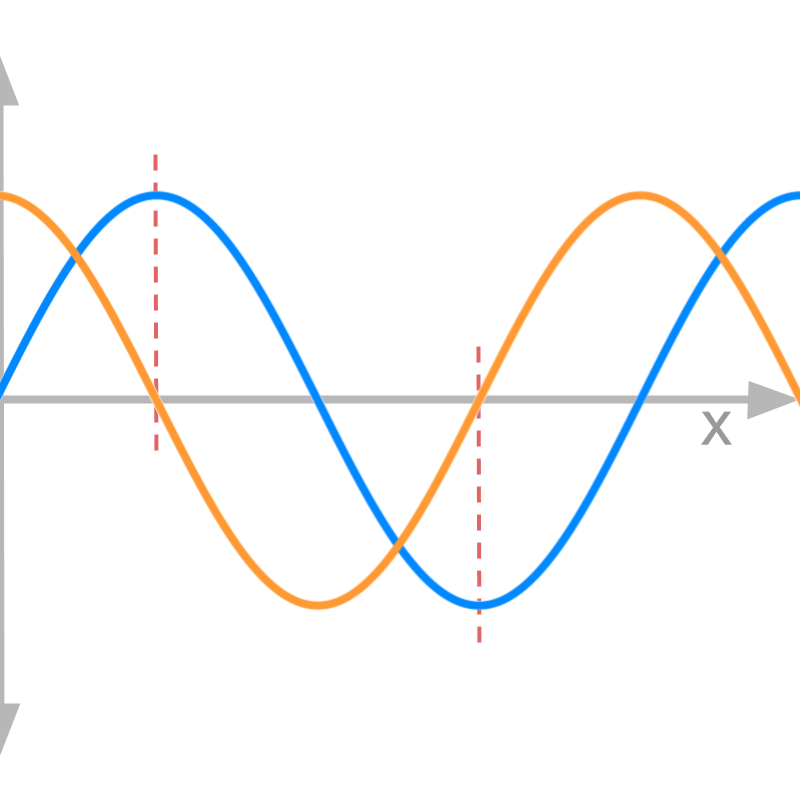
The figure shows in blue and in orange. Two positions are identified.
• when reaches maximum, the rate of change crosses from positive to negative
• when reaches minimum, the rate of change crosses from negative to positive
This is evident from the values on orange line, the derivative of the function, crossing the x axis at the positions of maxima and minima.
The slope of the tangent on curve is the derivative evaluated at that point.
example
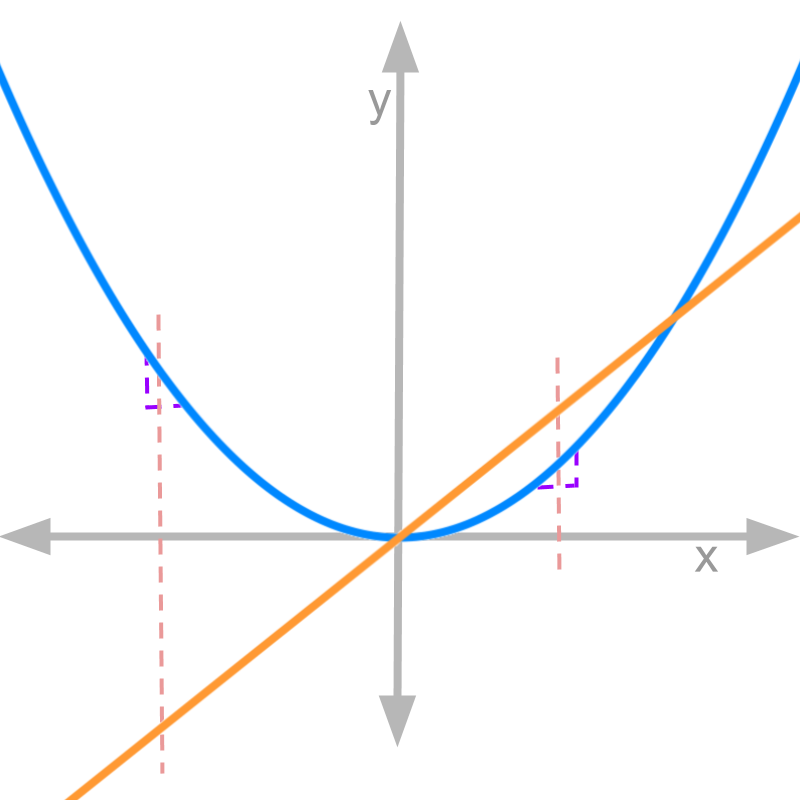
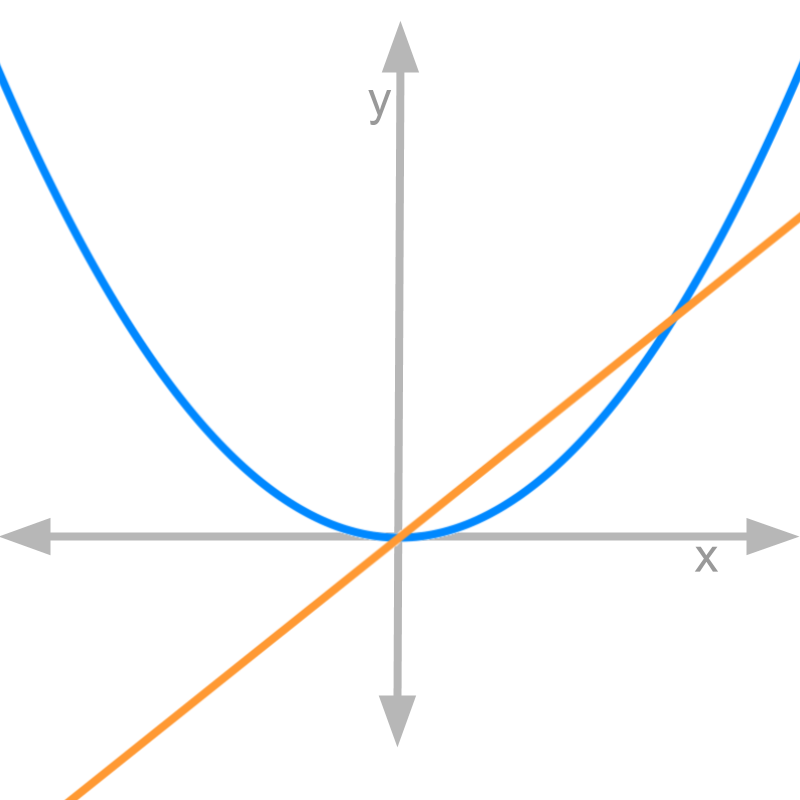
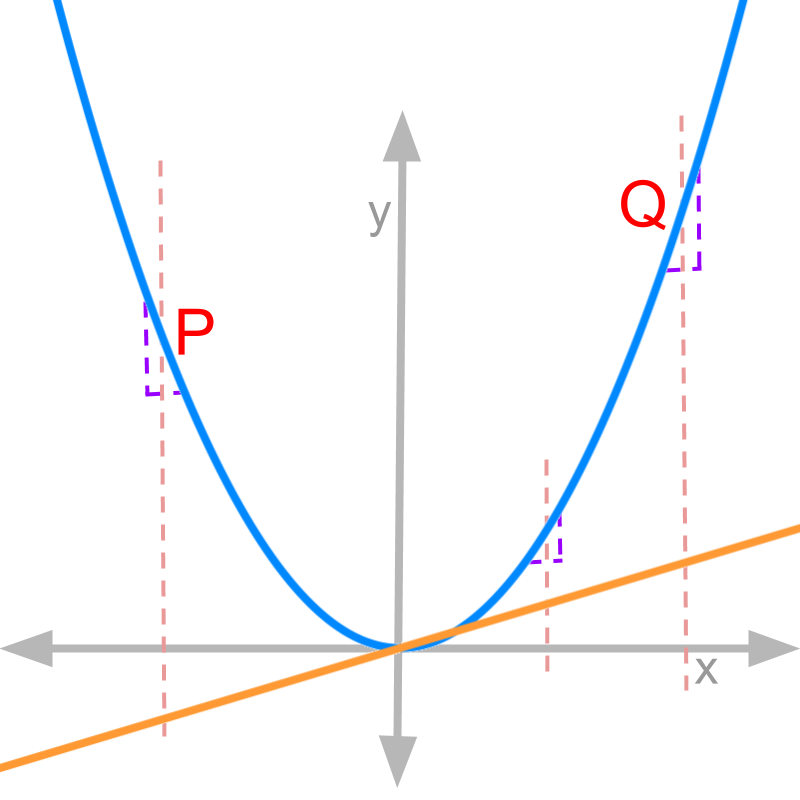
The figure shows in blue and in orange. The observations are
• for negative values of , the rate of change is negative
• for positive values of , the rate of change is positive
• at , the rate of change crosses from negative to positive
summary
Graphical Meaning of Derivative:
For a function , the derivative is another function of the variable.
• at a point , the rate of change of the curve is
• at a point , the slope of the tangent is .
• at the maxima of the curve , the derivative crosses from positive rate of change to negative rate of change.
• at the minima of the curve , the derivative crosses from negative rate of change to positive rate of change.
Outline
The outline of material to learn "Differential Calculus" is as follows.
• Detailed outline of Differential Calculus
→ Application Scenario
→ Differentiation in First Principles
→ Graphical Meaning of Differentiation
→ Differntiability
→ Algebra of Derivatives
→ Standard Results